3. Basic Functions
This section lists all the basic functions of ViCANdo, e.g. how to setup source, presentation, record a session, replay log file etc.
3.1 Setting up a CAN channel
Go to the Source dropdown in the menu bar and choose CAN Source, the following dialog will show up:
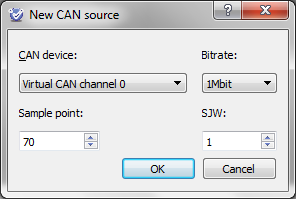
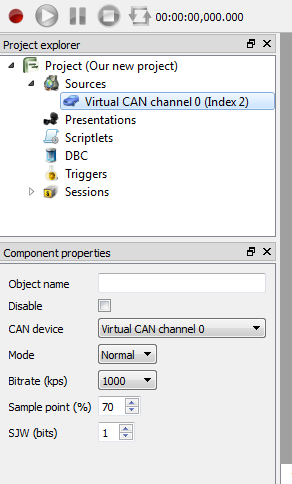
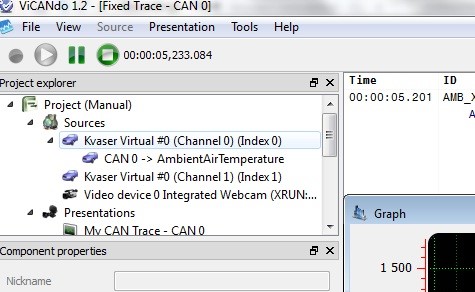
The new CAN channel will now be available under Sources in the Project Explorer. ViCANdo also allows you to change parameters like bit rate and sampling point from the Component properties dock.
Each source has a context menu when you right click on the source:
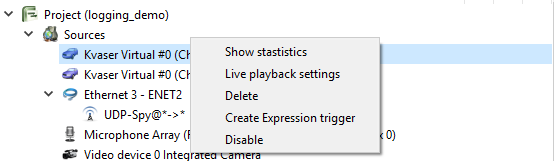
Select Delete to remove the source from the project. Select Disable to exclude the source from recording but keep it in the project.
Add a **Fixed trace* window for CAN source to view the CAN data.
To save the project, it is recommended to have a path without any Chinese or Japanese character.
3.2 Setting up a CAN FD channel
Go to the Source dropdown in the menu bar and choose CAN FD Source, the following dialog will show up:
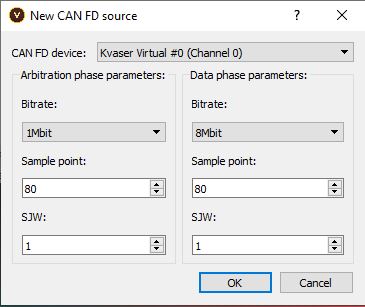
Note
At the moment CAN FD source can be only used with Kvaser and Vector device.
Add a Fixed trace window for CAN FD source to view the CAN FD data.
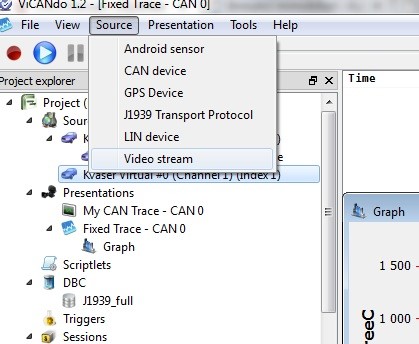
3.3 Setting up a Video channel
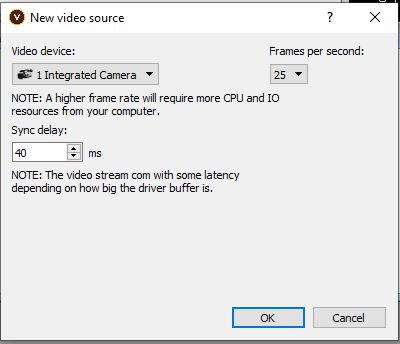
In order to set up a video channel, go to Source in the menu bar and choose Video stream. The following dialog will then appear on your screen:
Right click on the video source there is an context menu where you can disable, delete the source and create triggers from video source.
Note
Most USB cameras perform at 25 or 30 fps. However, more advanced cameras can go up to 60 fps.
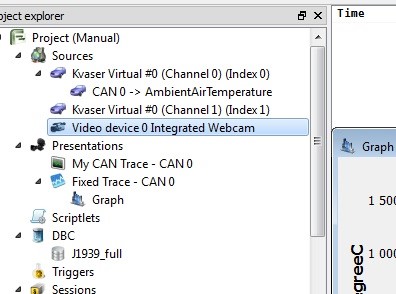
The new Video stream will show up in the Project Explorer. Its properties can be changed from the Component properties dock.
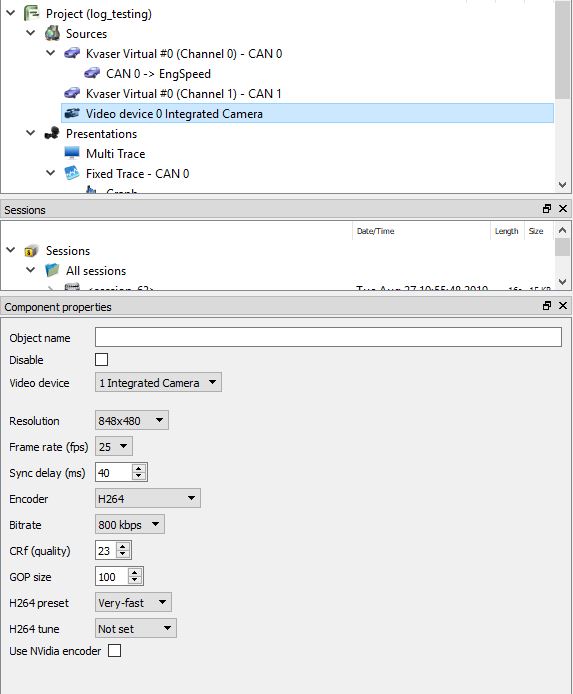
You can configure different encoder, resolution and other settings for the video source. Please note that image quality depends on many factors. It is recomended to try with different configuration to see the image quality and pick the best one for your application. Higher resolution and frame rate will result in bigger video file.
Note
A USB 2.0 High speed port can only carry 480 Mbps of data traffic which means that if you have a hub on the port, all your connected devices must share the 480 Mbps. This means that you can only have two 720p cameras on a USB 2.0 High speed port. Some computers have internal USB hubs. If your computer has 4 external USB 2.0 ports they might even be under the same internal USB hub. To find out how your USB ports and devices are connected, you can use USBview on Windows after downloading it from http://www.ftdichip.com/Support/Utilities/usbview.zip while on Linux, you can use lsusb, which is available in it by default.
3.4 Setting up a CAN fixed trace with database file
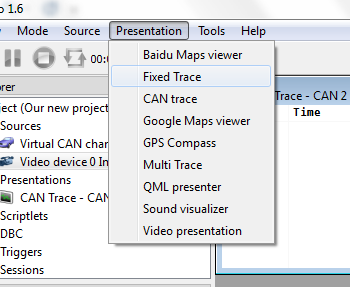
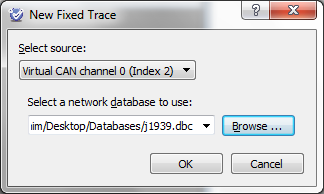
Select the ‘Fixed Trace’ option from the Presentation menu.
In this case, you will also have to add a database file and not just the CAN channel. Select the correct database file. A good idea to do so would be to keep the database file in your ViCANdo project folder. This will make it easier to share completed projects in a later stage. Apply the selected database and press OK.
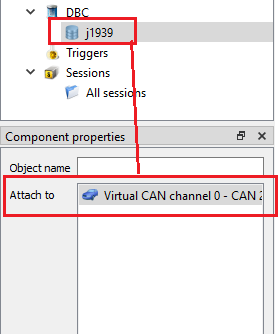
If you want to transmit messages/signals from the DBC file in Traffic Generator tool, you need to associate the database to the correct CAN channel you want to transmit: Keep the database selected, select the CAN channel in the Attach to field.
Note
One database can be associated to several CAN channels.
To go live (but not start any logging activity), click the red Record button at the upper left corner.
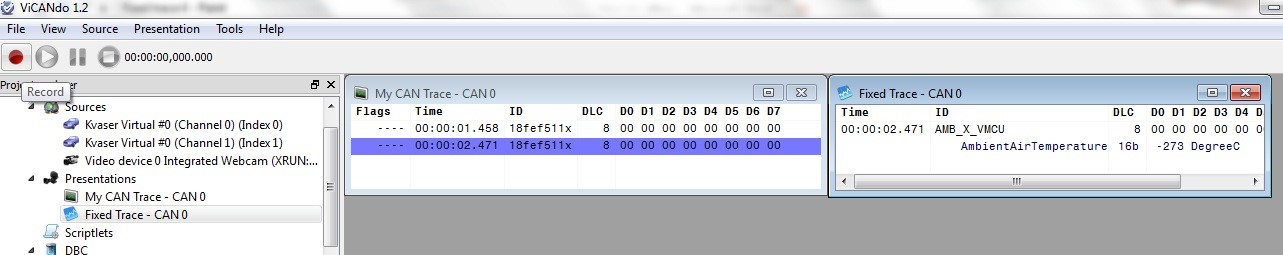
The result will show up immediately.
By right clicking a signal, a lot of options show up. In the Advanced manual and in our web trainings, you can learn more about these different functions that can be triggered by right clicking on signals.
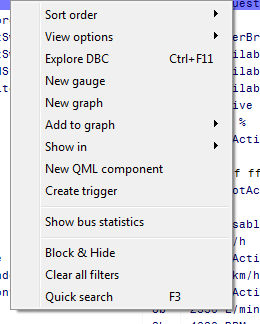
For example, View options->show flags column will display the flags column in the Fixed Trace window.
The flags column is used to display the flags of the frame:
e.g. “Tx*HRWFNE”
For example:
- Tx——- means it’s a tx ack message
- –*H—– means there is hardware overrun error
- –*S—– means there is software overrun error
- –*X—– means there are both hardware and software overrun error
- R means it’s a RTR frame
- W means the frame is in Wakeup mode
- F means it is a CAN FD frame
- N means NERR was active during the message (TJA1054 hardware)
- E means Error Mask. To mask the non-info bits
You can see the many available function options for the fixed trace window.
At any time if you press the function key F3 while you have your cursor in the fixed trace window, you can open a quick search dialogue. If you type in any signal name and press F3 again, the next hit in the trace window containing that particular word would show up.
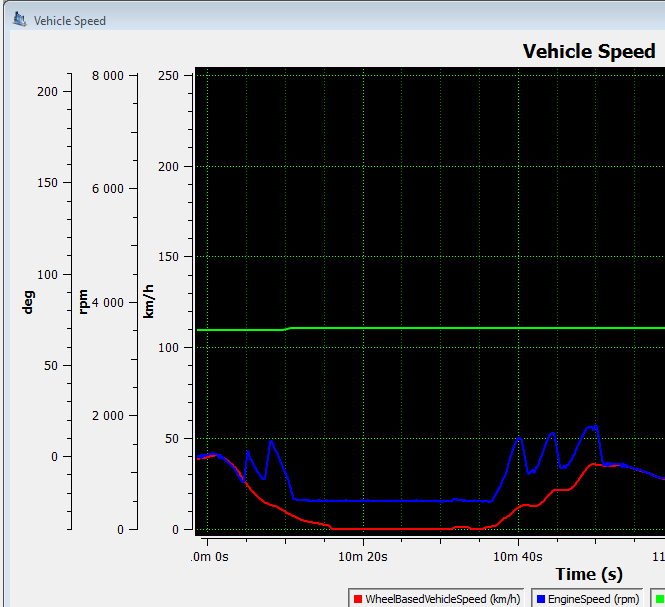
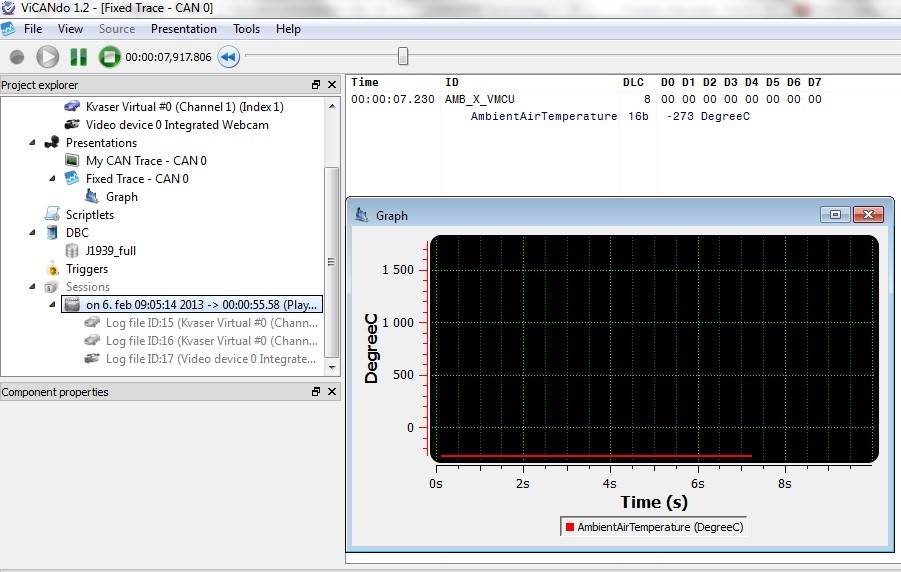
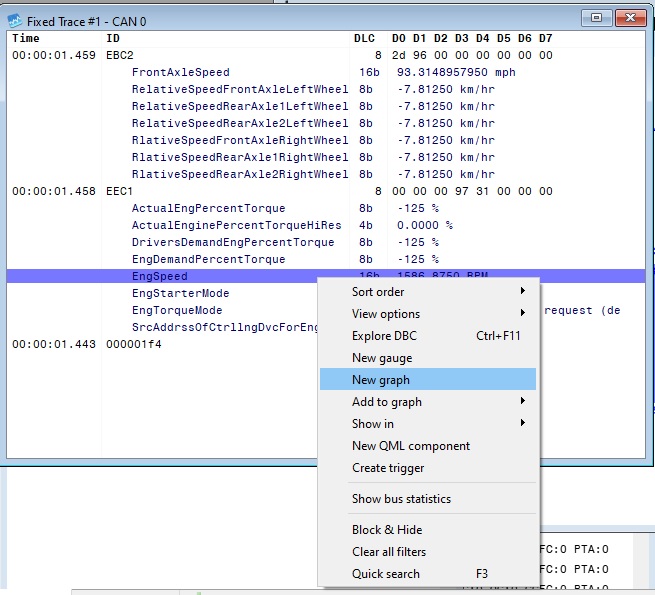
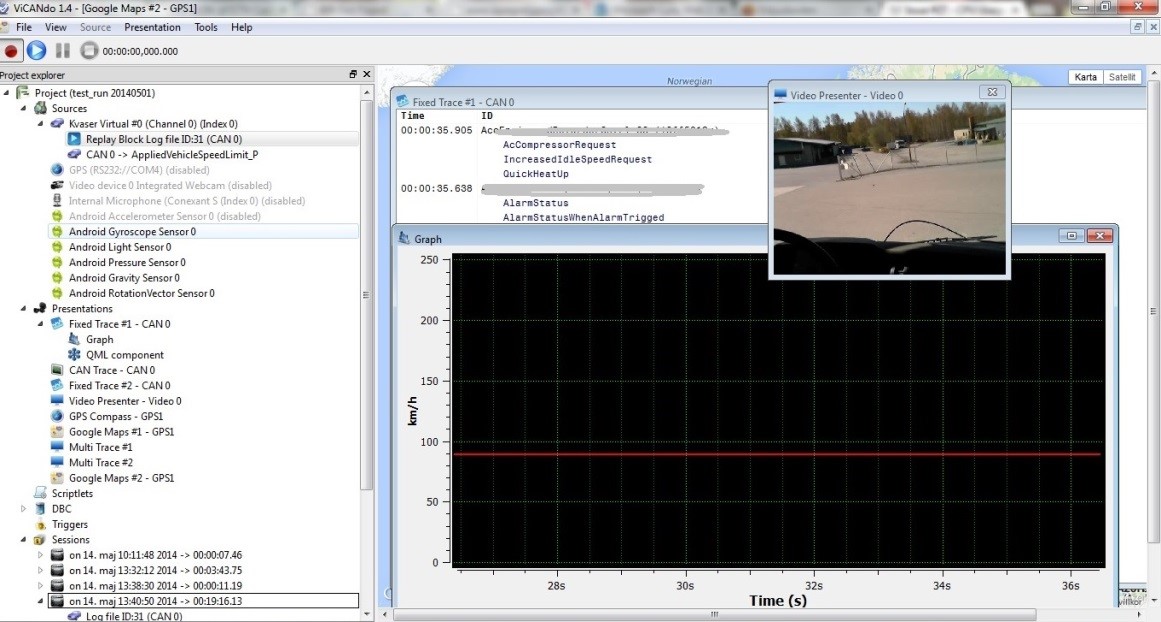
As an example, we add a signal to a graph from the Fixed Trace window. Next, we right click on the signal and select the Add to Graph option.
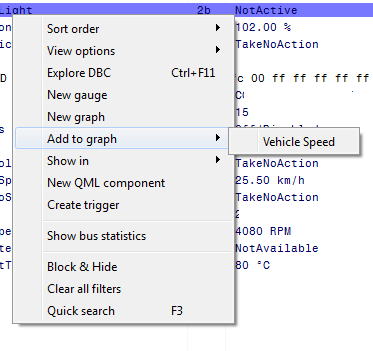
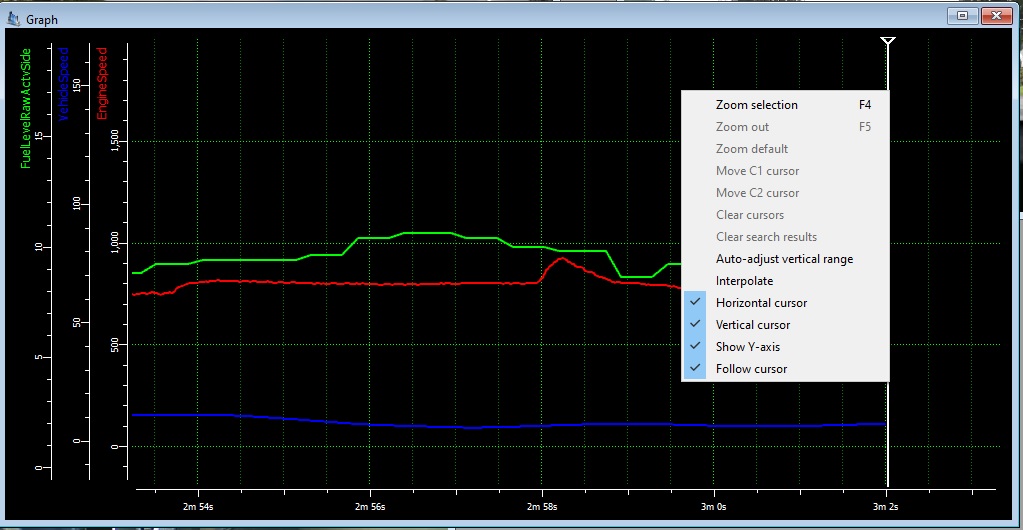
This will result in the signals showing up in the Graph window
3.5 Setting up a Video presenter
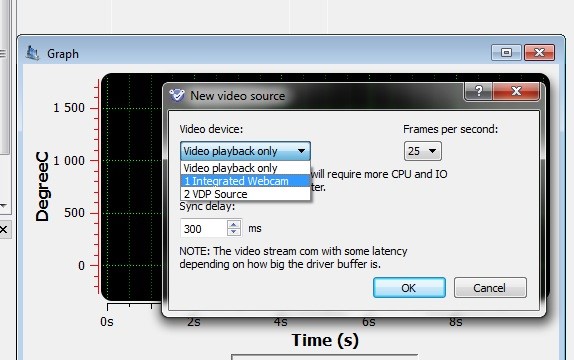
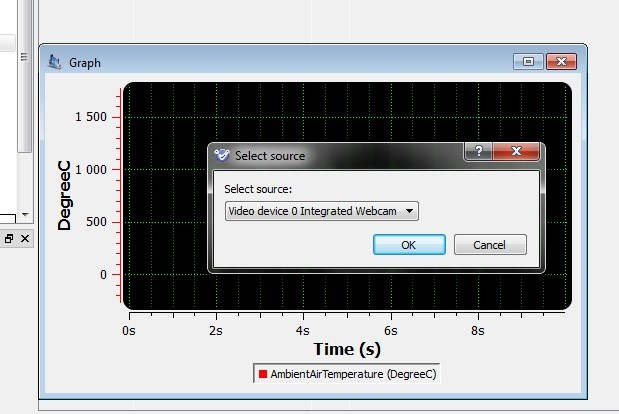
Start by first selecting a source.
Once you do so, a window shows up. In most of the cases, you don´t have to care about the settings as they are normally picked up directly from the driver of the unit. However, in some cases you might want to adjust the number of frames per second and/or the delay.
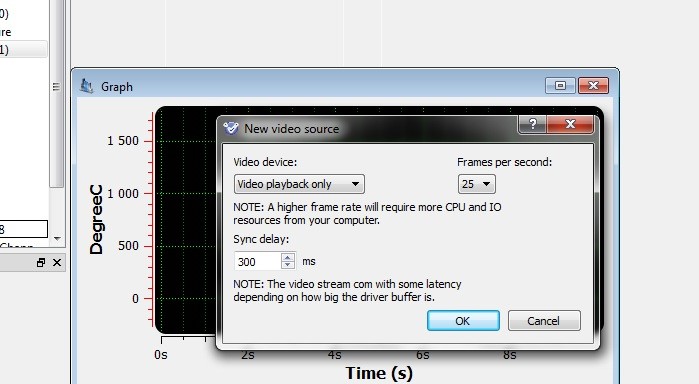
In this case, we use the built in video camera on our laptop.
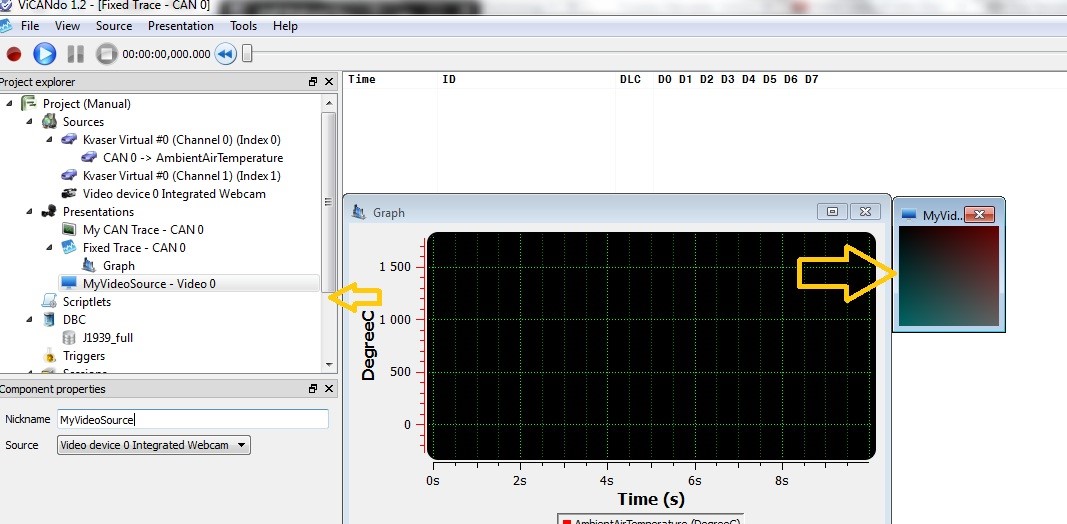
Once we have a source that shows up in the source panel, it can be linked to the video presentation window as well as to the Multi trace window.
In this case, we will choose the video presentation window.
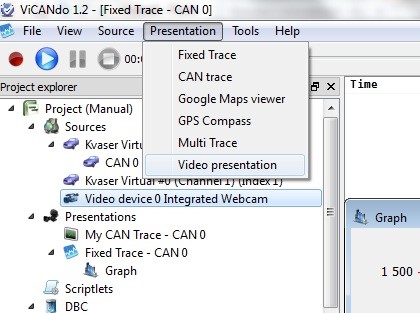
Assign the source to its presenter, just as we did with CAN sources (or any other source in ViCANdo) before.
The video presenter will appear immediately in the measurement.
The video log files will be recorded and logged separately from all other sources and the more cameras you add, the more video log files you will have.
3.6 Recording a session
ViCANdo has two basic states – Recording and Replay. By pressing the Record button in the upper left corner, you can do a couple of things:
- Take control of the timing issues in the measurement and calculate timing off sets of all the sources in the measurement set up
- Display all active sources with their respective active presenters in real time.
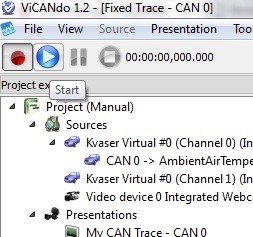
However, nothing gets logged until you click the blue Start arrow button.
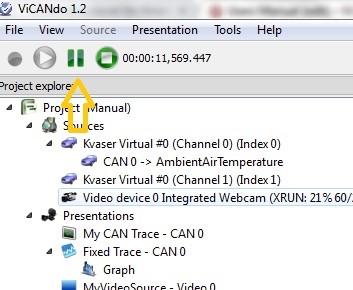
You can pause the measurement by clicking the Pause button.
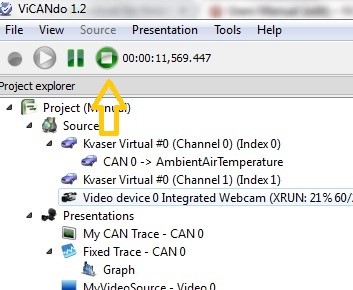
Or stop it completely, by clicking the Stop button.
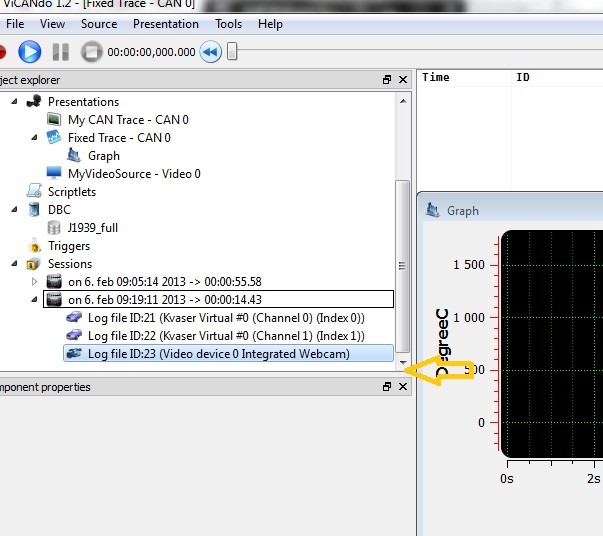
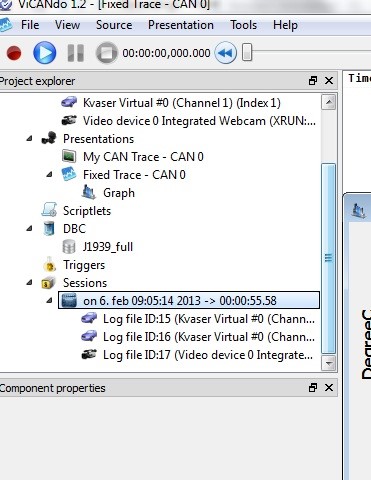
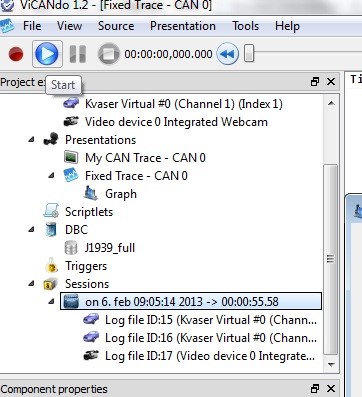
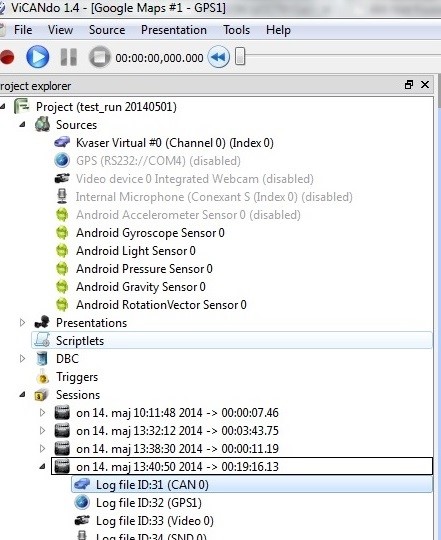
Your first recorded log file will show up under Sessions in the project tree. The log file will automatically be named according to the date and time when the recording started.
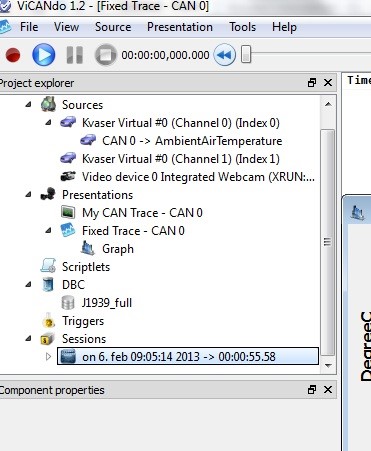
Since version 4.0, the session has its own window with more useful information such as length, size of the session. e.g.
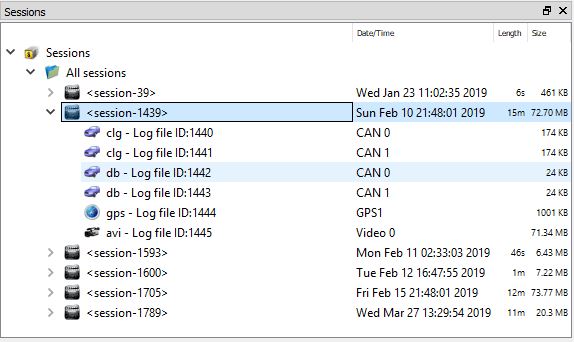
If you expand the Sessions list, it will show you the sources that have been recorded. These are kept as separate log files with their own source time stamping but ViCANdo also puts a common time stamp on all of them.
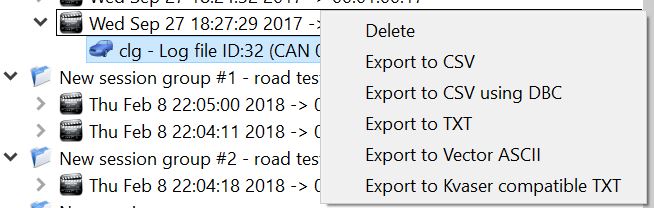
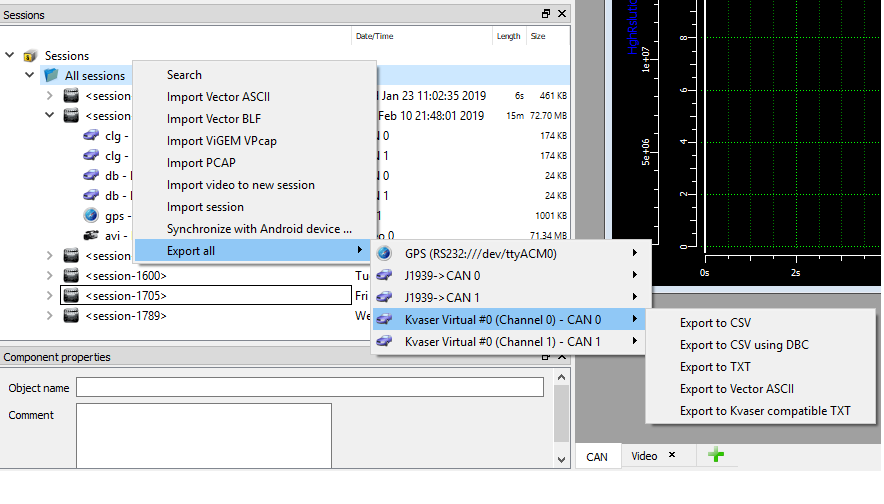
When right clicking on the log file, you can export the log file to supported standard formats from the menu, see below figure. This makes it possible for you to replay your log file or make post analysis in tools other than ViCANdo, if needed.
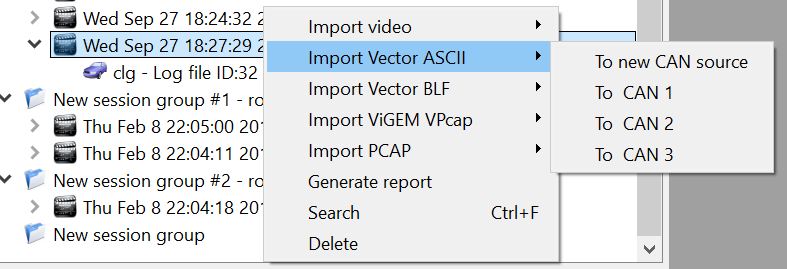
When right clicking on the session, you can import other log files with supported format to the selected session, either to a new source or to the existing source in the project.
All the recorded sessions are kept under All sessions in Sessions in the project tree. When right click on the Sessions, a menu will show up.
When selecting New session group, a new session group will be created for you on the bottom of the session list. You can drag and drop the existing sessions into the new group according to your needs. For example:
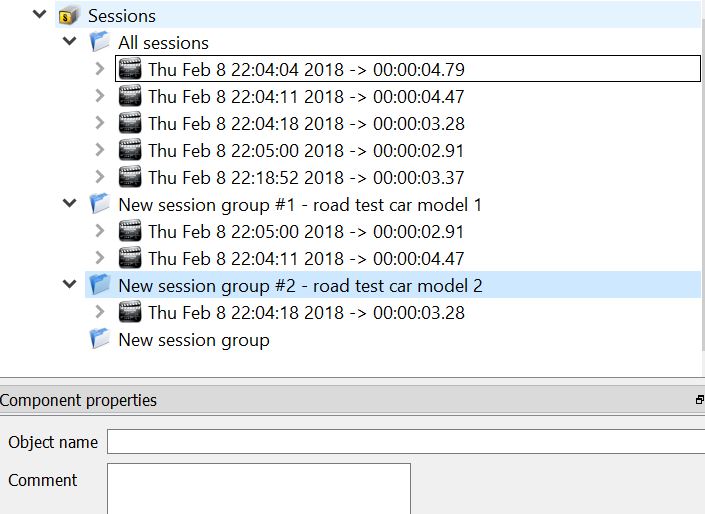
The session group name can be modified when double clicking on it.
Note
Drag and drop existing sessions to the new session group doesn’t mean a copy of the session has been made. It only means that the session is belonging to the new session group. The session is still kept under All sessions. When you remove the session from the new group, the session will not be removed under All sessions. To remove/delete the session from the project completely, you need to select the session under All sessions and right click on it and select delete from the menu.
3.7 Replaying a session
In ViCANdo it is possible to both replaying a session inside the software and replaying a session lively back to the sources from where the data came. e.g. it can replay the CAN data back to the CAN bus via the CAN interface you have configured in the project.
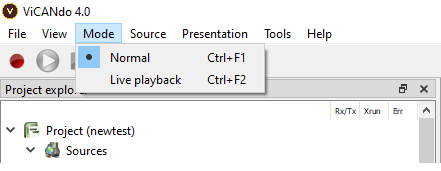
From Mode menu you can select which way to replay the session:
3.7.1 Normal mode
Normal replaying mode is simple and default. You don’t need any real hardware to be connected. All you have to do is first select the session you would like to replay.
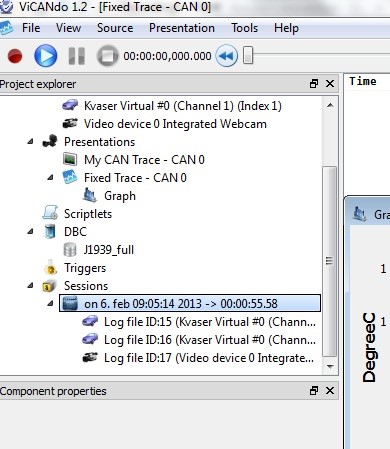
Then, press the blue Start button in the top left corner.
This will result in the log file with all its contents to get replayed.
3.7.2 Live playback mode
To be able to live playback the session, you need to check that all the sources were configured correctly. You will need i.e. CAN interface, cameras, lidars etc. hardware depending on the configuration of the project. All the data inside the session will be transmitted via the hardware configured in the project. It is important that you know what you are doing before live playing back the session, for example, some CAN messages may cause problems to the connected system.
TO live playback the session, from Mode menu select the Live playback and then select the session you want to play. Click the blue play button on the top left corner.
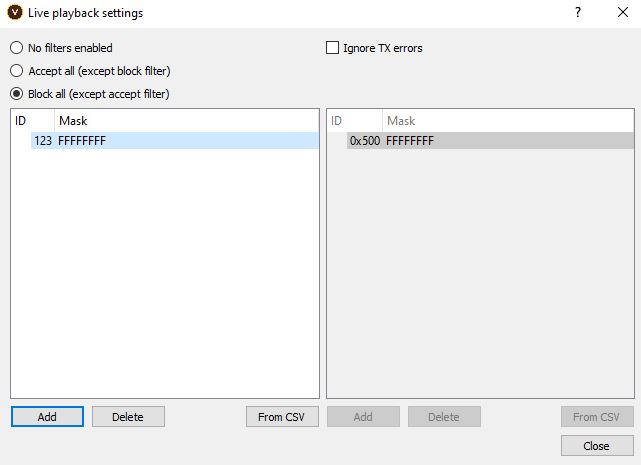
Live playback filter settings
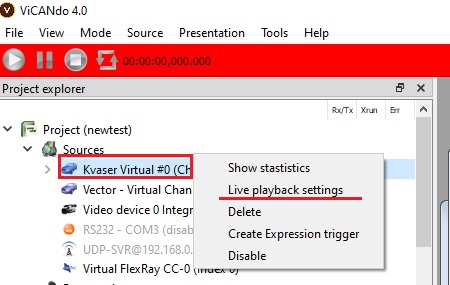
Just in case you want to block certain messages to the network while live playing back the session, you can configure it by right click on the source where the messages were logged and select Live playback settings menu.
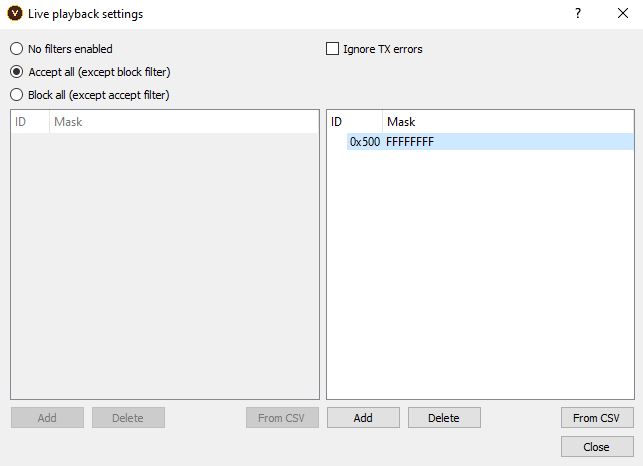
The settings window looks like this: Below image shows you the message with ID 0x500 will be blocked, while all other messages in the session will be sent out to the real network.
Below image shows you only the messages with ID 123 will be sent out to the real network, while all other messages in the session will be blocked.
3.8 Session Crop and Clone
This chapter describes the feature to cut session from a session in Vicando since version 4.0.
3.8.1 Manually cut the session
Sometimes you want to cut a small clip from a long session. This can be done manually by following below steps. Let’s assume you have a session A, and you want to cut a small clip with a length of 10 seconds from it. You will need to:
- On the session timeline bar, right click and select Crop to set the start timestamp to crop
- On the session timeline bar, right click and select Crop to set the end timestamp to crop
- In the session tree view, right click on the session and select Clone/Dublicate session, which will clone the selected range into a new session on the disk. You will see the newly cloned session is added to the tree view.
- Select the original session’s timeline bar and select Crop -> Reset crop to clear the crop status
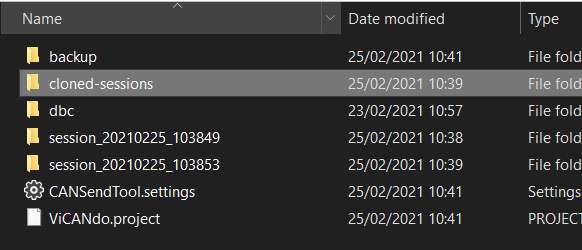
As you can see in the tree view, the newly cloned session will be added to the global session list “All sessions” in the session tree view, with a suffix name #N where N means the generation. For example:
* Any clone of session A will be <cloned-session-name> #1
* Any clone of <cloned-session-name> #1 will be <cloned-session-name> #2
* Any clone of <cloned-session-name> #2 will be <cloned-session-name> #3 and so on
A symbolic link will be added under the “Cloned-sessions” folder in the tree view. All the cloned sessions will be saved under the folder called “cloned-sessions” in the project directory on the disk.
To delete the “cloned session”, you need to select the “cloned session” in the “All sessions” folder in the tree view.
Watch the video below to learn how to cut the session in Vicando:
3.9 Session search
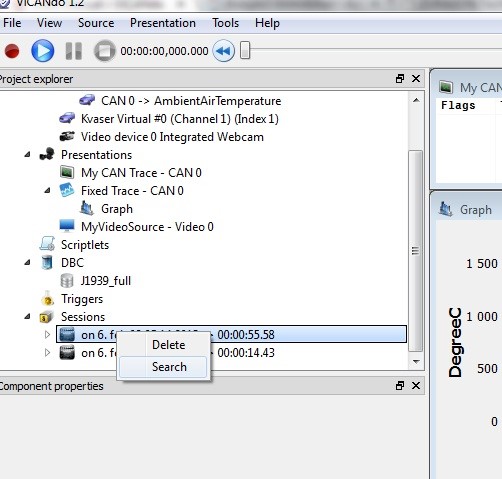
All the logs in ViCANdo are saved in a Session, which consists of all the log files taken at a certain time. By right clicking on session or log file, a menu will show up to let you play with the selected session or log file.
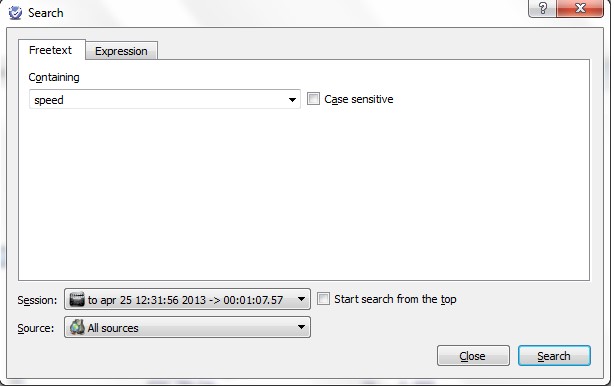
You can make a free text search in a session and all items in the log file are searchable, no matter which source they come from. To do so, start by right clicking the session that you would like to search.
The following dialogue box will appear on your screen.
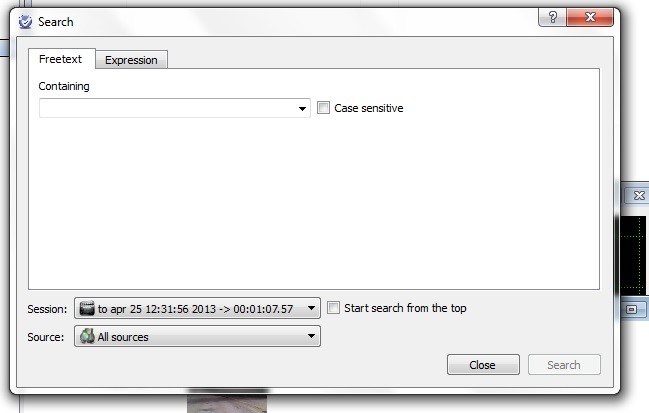
Next, type in the keyword you would like to search (eg. “speed”) and press the search button.
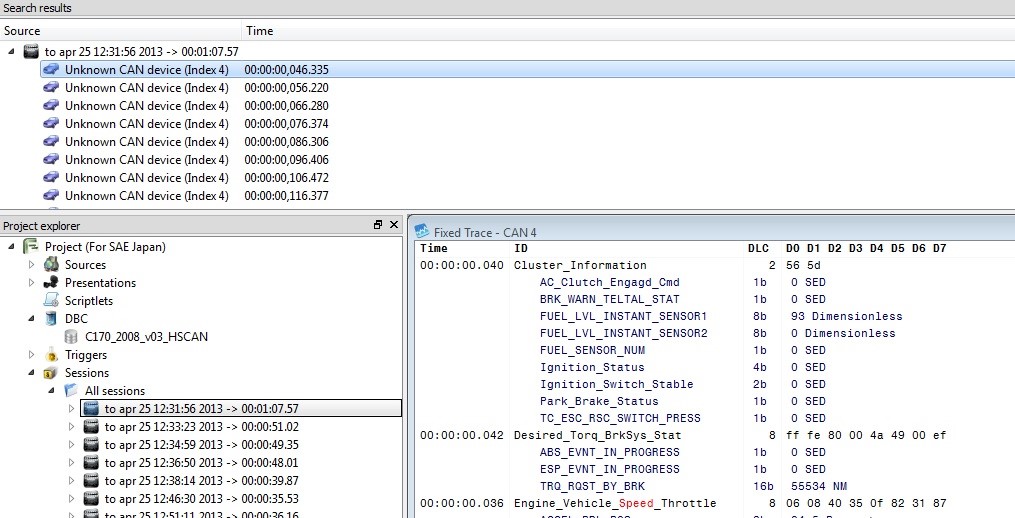
Following this, a list of hits will appear in a new window (Search results) and moving between the hits, the various windows (in this case the fixed trace) will highlight the hits in red.
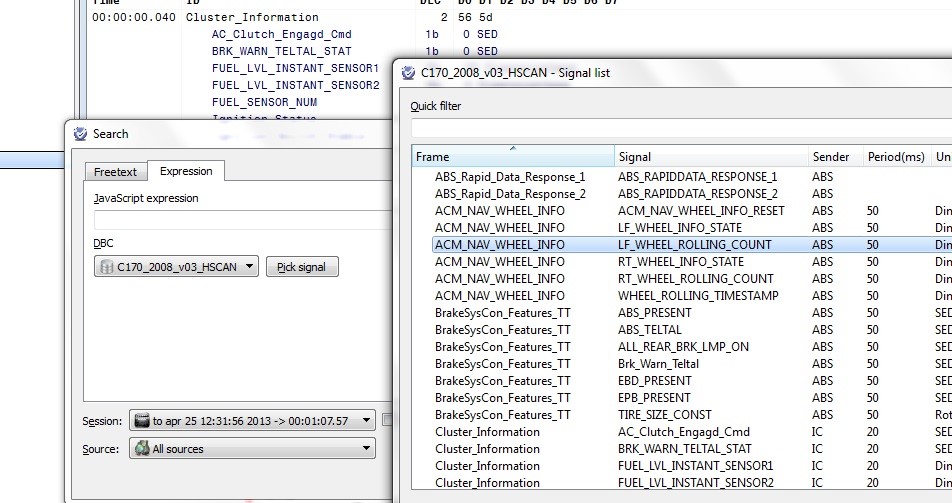
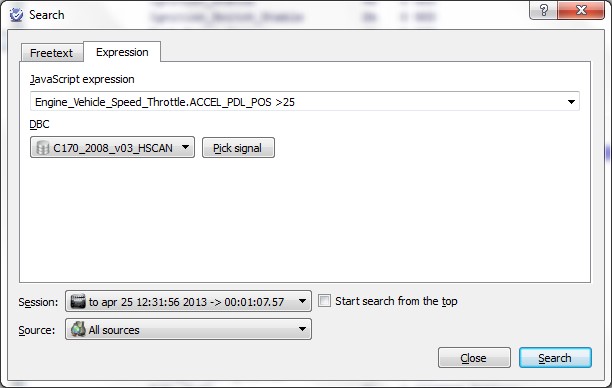
Another more advanced way is to use the expression Search tab. By clicking on the Pick signal you can use the database file and search for a specific signal.
You can also create more complex search criteria using JavaScript logics.
3.10 Graph Window
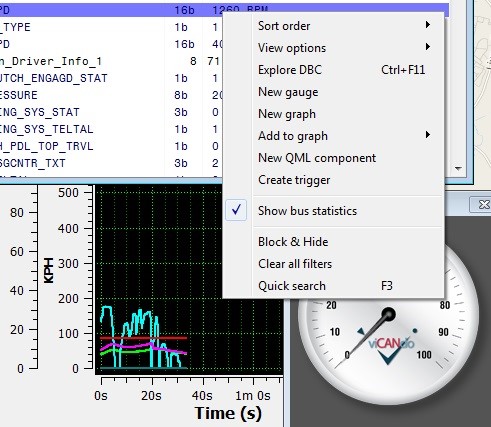
It is possible to visualize single or multiple signals using a graph from the Fixed Trace window. All you have to do is right click on a signal and select the option, New Graph.
The graph window will be shown automatically. If you want to add more signals to this graph, just right click on the signal in Fixed Trace window and select Add to graph.
The properties of the graph window are available under its component properties tab in the project window.
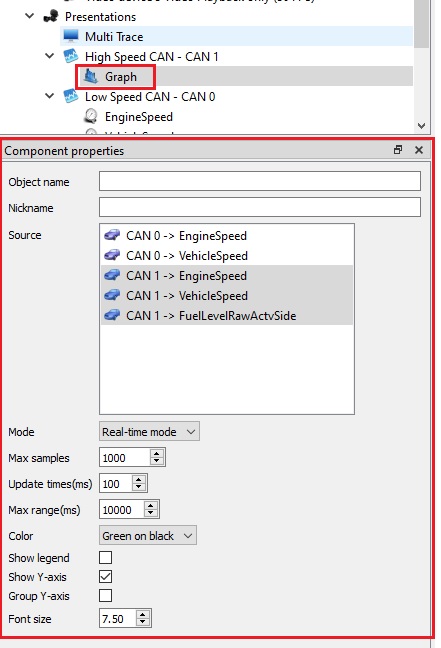
Source field shows the activated signals on the selected graph window.
Mode has two options, “real time mode” will display the values of the signal until current paused timestamp if session is paused. If session is playing or recording, the value of the signal is in real-time. “Overview mode” will display all the value of the activated signal on the graph window inside the session. Other properties are generical graph properties you can configure. It is also possible to select & right click on the graph window to configure the settings using the context menu.
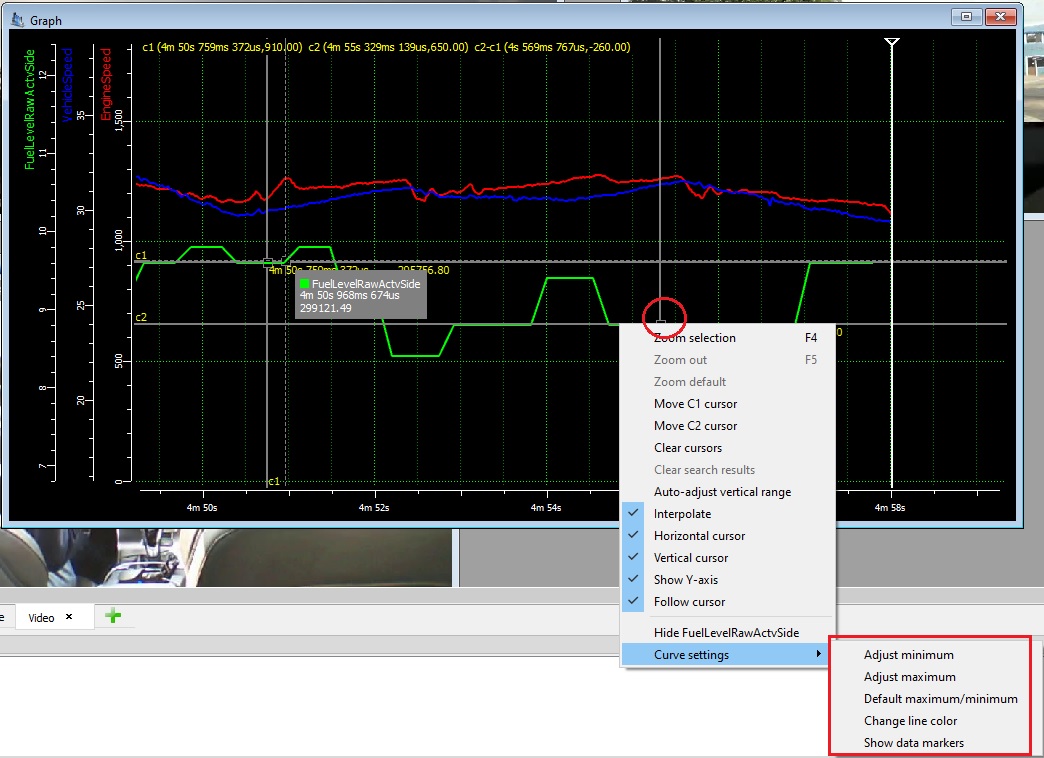
If incase you want to adjust the scale of the signals displayed or change the color of the graph in the graph window, right click the signal symbol that is present under the graph window.
To measure the distance between two points in the graph window, left click on the first point and move the cursor to the 2nd point for measurement.
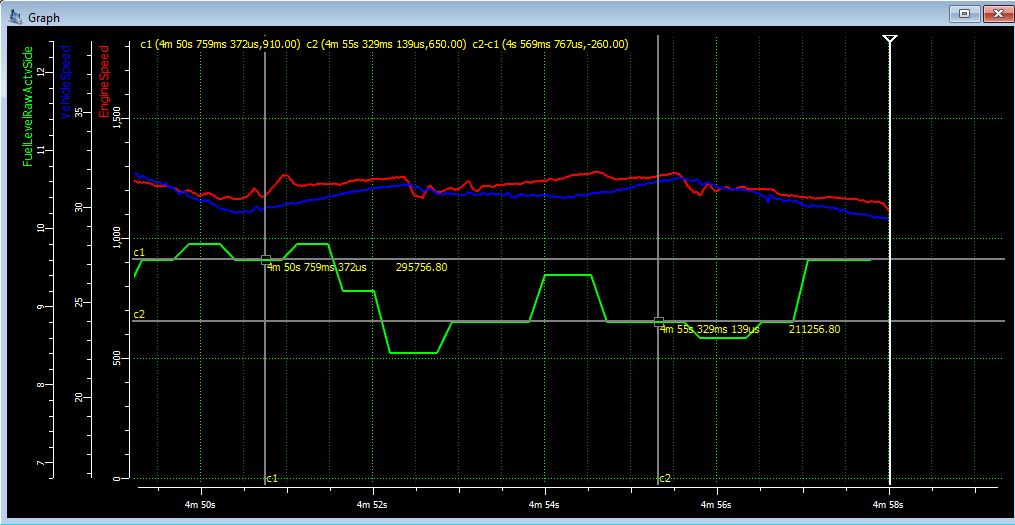
Right click on the cursor, you can also change the cursor settings from the menu.
3.11 Setting up Triggers
The software supports event driven triggers on reception of the data.
The trigger module works like this:
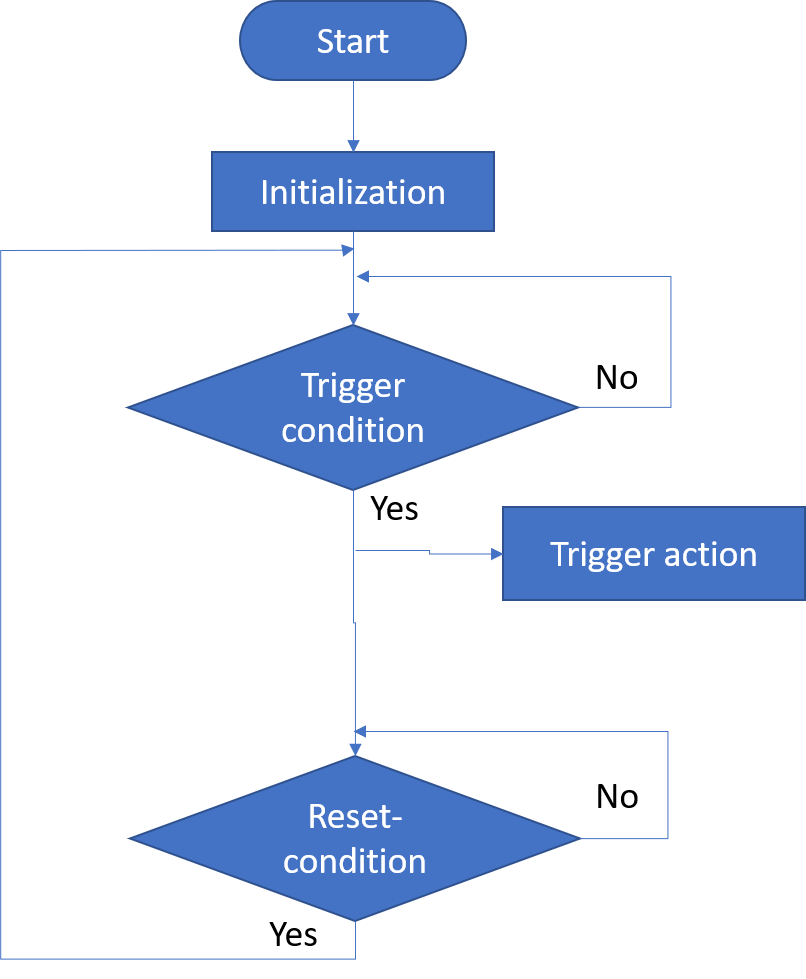
There are two trigger modes: Standard mode and extended mode.
The standard mode trigger allows you to trigger on one signal/source at a time.
The extended mode trigger allows you to trigger on multiple signals/sources at a time with customized javascript scripting support.
3.11.1 Standard mode
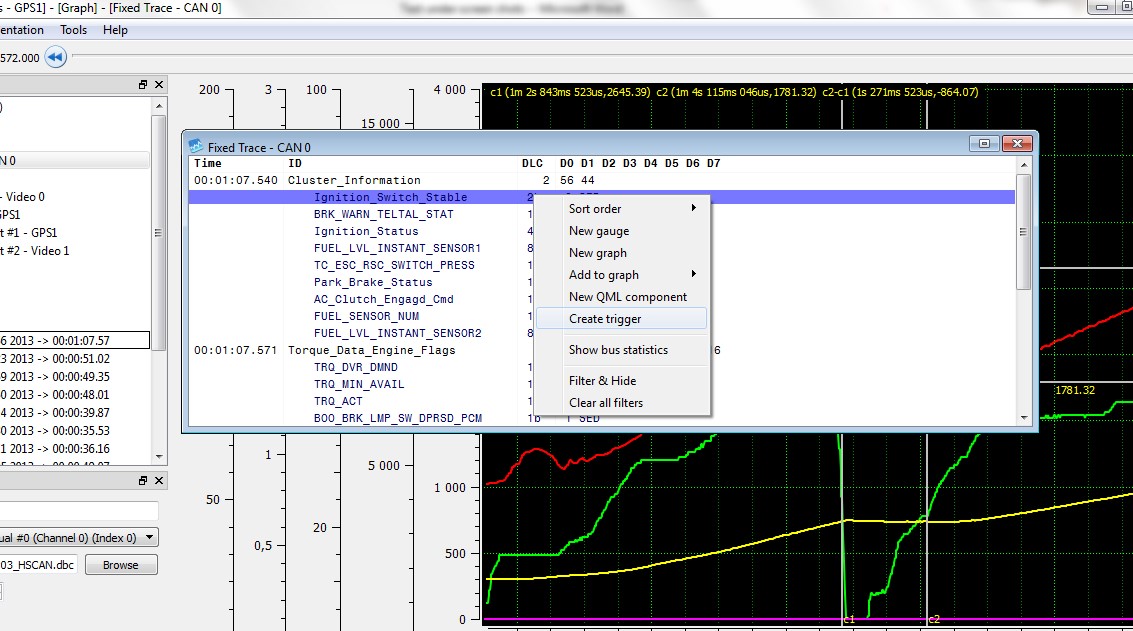
To create a trigger using a CAN signal, right click the signal in the fixed trace window.
After you’re done creating the trigger, it will show up in the project tree from where you can edit its properties.
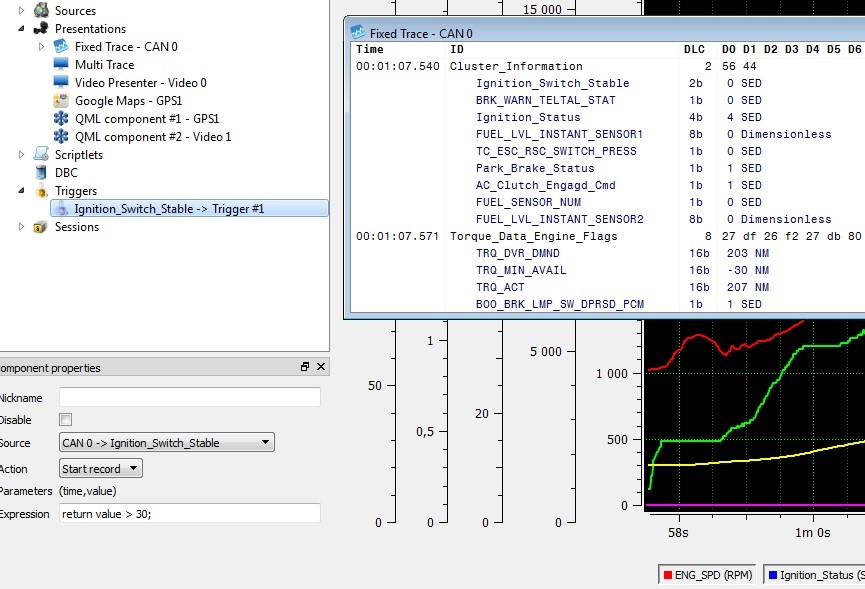
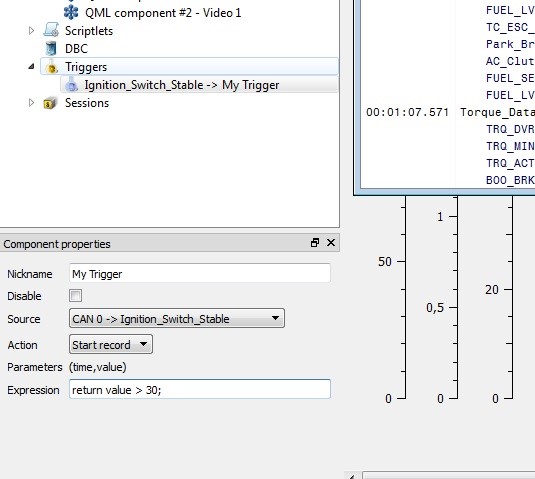
Below screenshot explains the parts of the trigger properties:

You can adjust the trigger’s properties in various ways so as to start or stop a recording based on various parameters and give the trigger its own display name.
Example – The command “return value > 30; ” means that the trigger will go off if the CAN signal value exceeds 30 and recording will begin.
It is also possible to create multiple triggers to one signal. Below example shows you how to start and stop recording based on a signal.
There is a Pre-trigger(ms) property in the Component properties window if you click on the Project, it will buffer the configured time of data before starting recording the session. For example, if you configure the pre-trigger to 8 seconds and click record button, ViCANdo will buffer 8 seconds of data before you click start button. If you record a session of 10 seconds, the session will be 18 seconds long. The Return to armed check box is for activating the project again after action Stop record is triggered. The Limit record time check box is to specify if you want to have fixed time duration for each log/session.
For example:
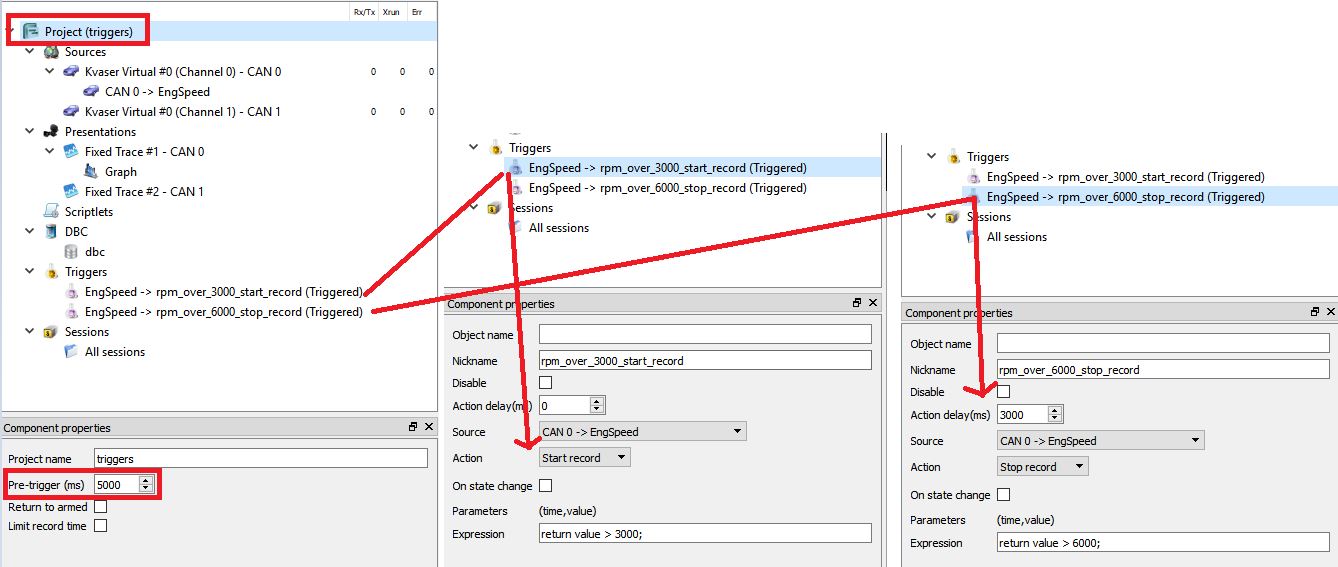
After the red Record button was clicked, ViCANdo will buffer data and time from the CAN interfaces. The above trigger configuration will start recording 5000 ms before the value of EngSpeed over 3000, it will stop the recording 3000 ms after the value of EngSpeed is over 6000. The Action delay(ms) is used to specify the time to delay executing the Action.
Below example shows the edge detection of a signal by using the trigger:
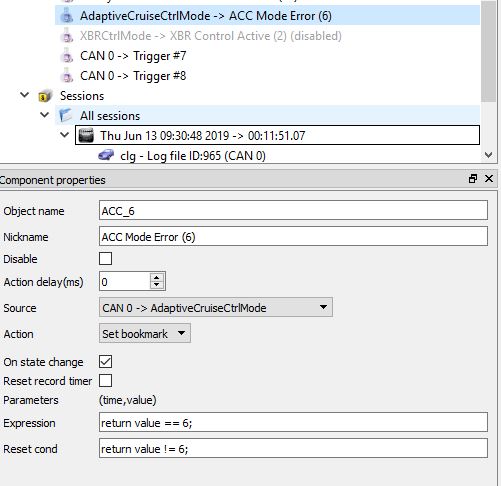
When the value of the signal AdaptiveCruiseCtrlMode is equal to 6, it will set the bookmark. Then when the value is not 6 it will reset condition. This is important to configure to set the bookmark only when the value reaches 6 and will not set the bookmark when the value keeps at 6. e.g. if you want to set the bookmark for vehicle speed over 120 km/h, you need to configure both Expression and Reset cond.
A multiple trigger example project can be downloaded from here
3.11.2 Extended mode
This mode allows you to trigger on multiple signals with configurable condition.
The steps are as follows:
- Right click on the CAN signal(SignalA) on Fixed Trace and select “Create trigger”, it will add a default standard-mode trigger to the project tree.
- Change the mode of the trigger to “Extended mode”.
- Right click on other signals(e.g. SignalB, SignalC) on the Fixed Trace that you want to add for triggering, and select “Create signal”, it will add this signal as a “slave source” under the CAN source the fixed trace is attached to.
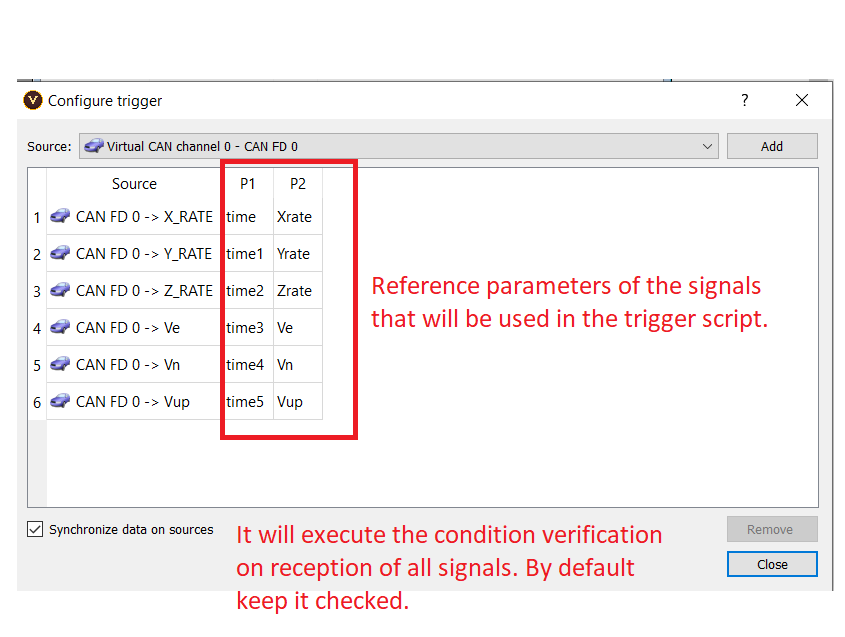
- Then click on the “Configure” button on the component properties window of the trigger and add the “slave source” of “SignalB and SignalC” from the source dropdown box.
- Configure the parameter for each signal, the parameter will be used in the script of the trigger. It should be valid JavaScript variable.
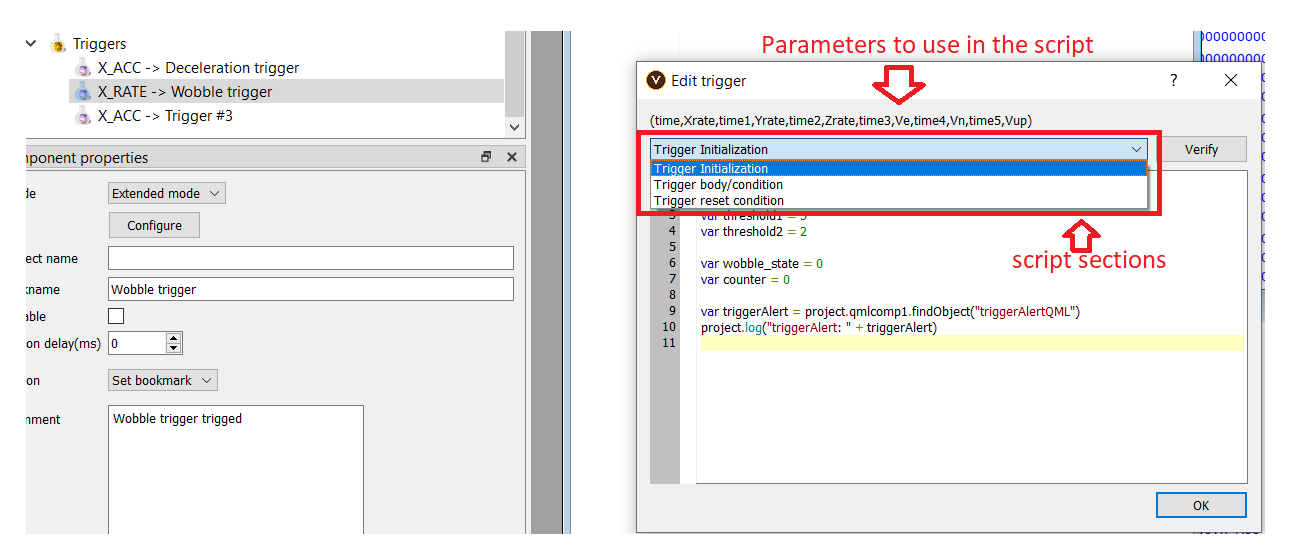
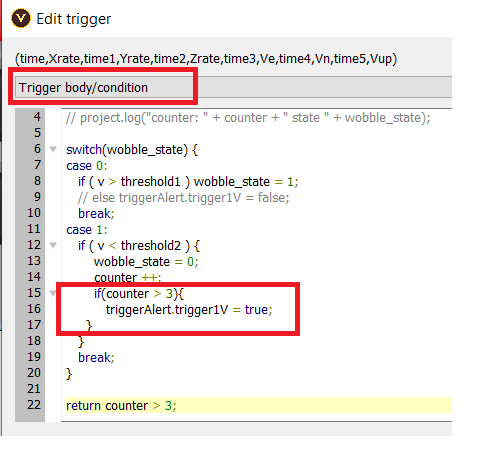
- Click on “Edit trigger” button on the component properties window and write the script(init, condition and reset-condition) of the trigger.
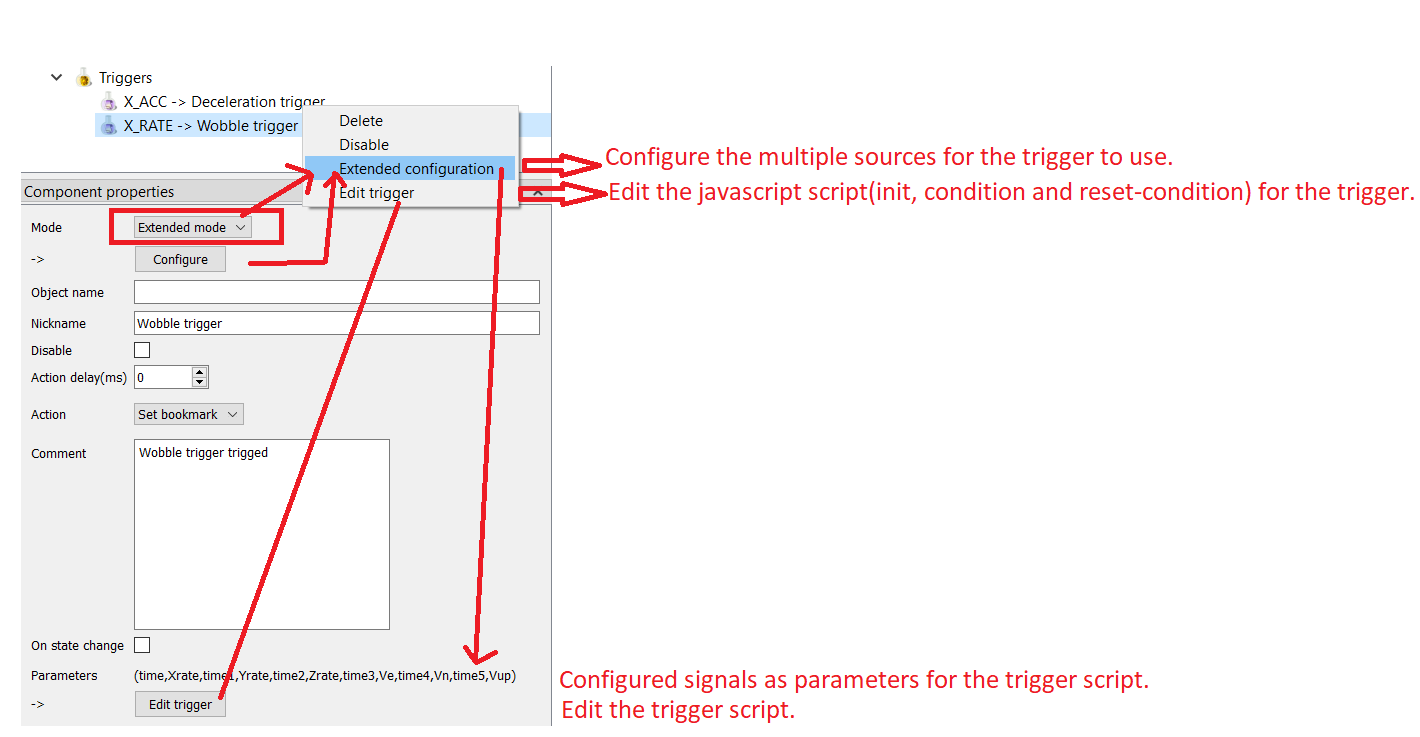
Configure the source for extended mode trigger:
Write the script for the trigger:
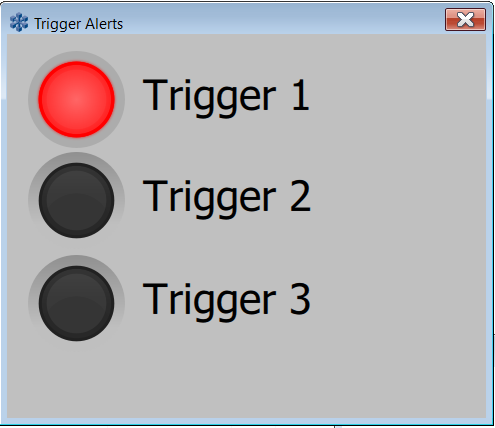
In the trigger script, you can also create QML component to visualize the triggers. For example, light up a LED to indicate the trigger state.
QML component example that was accessed by the trigger script:
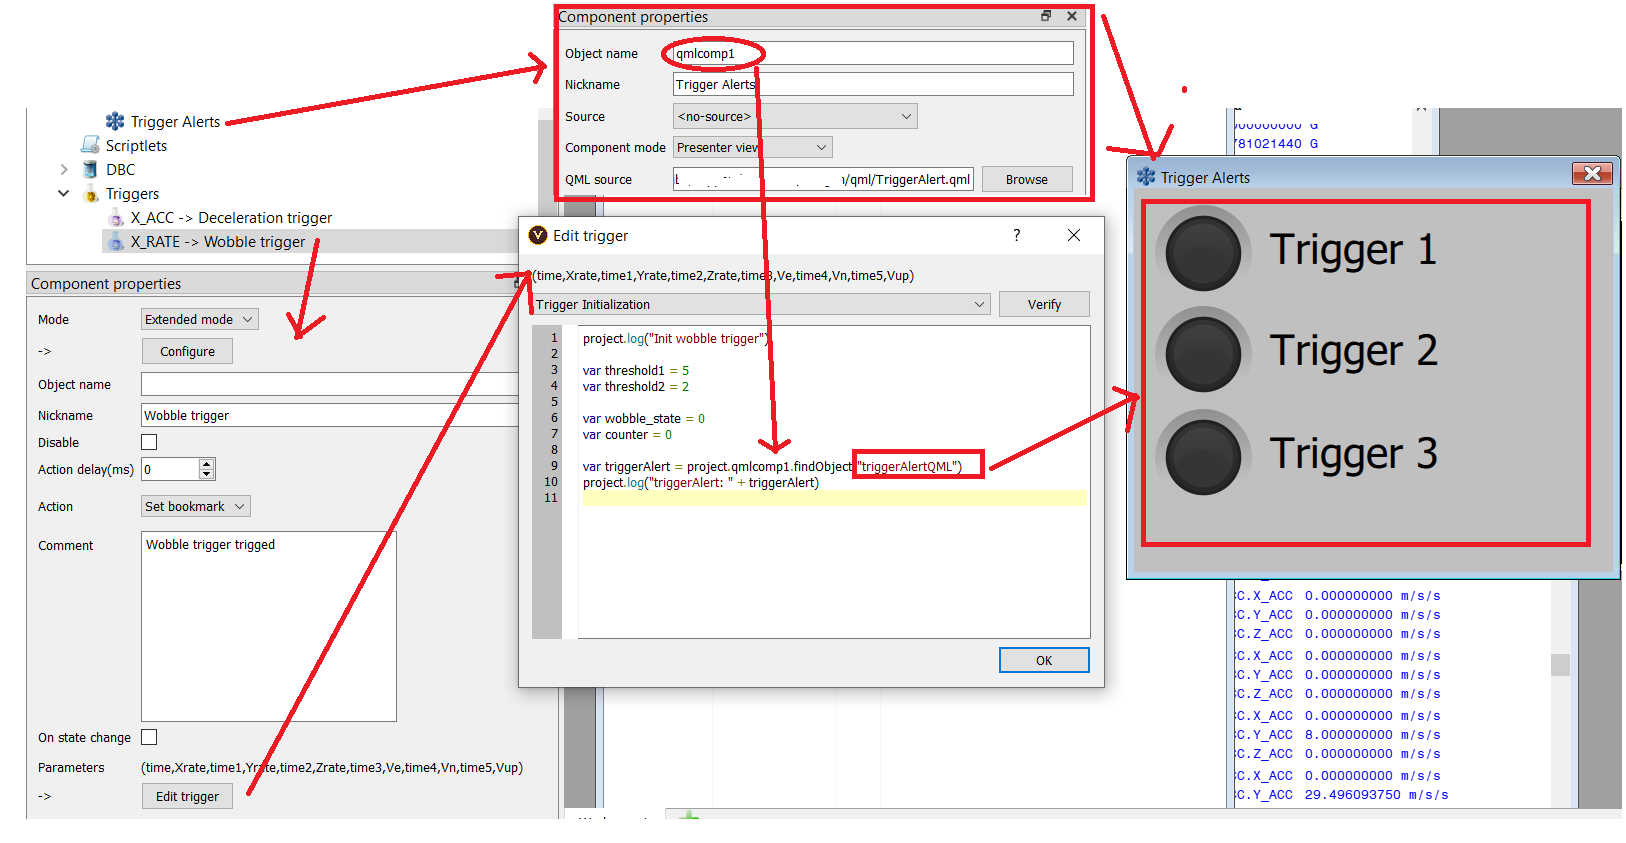
To define the object on the QML file:
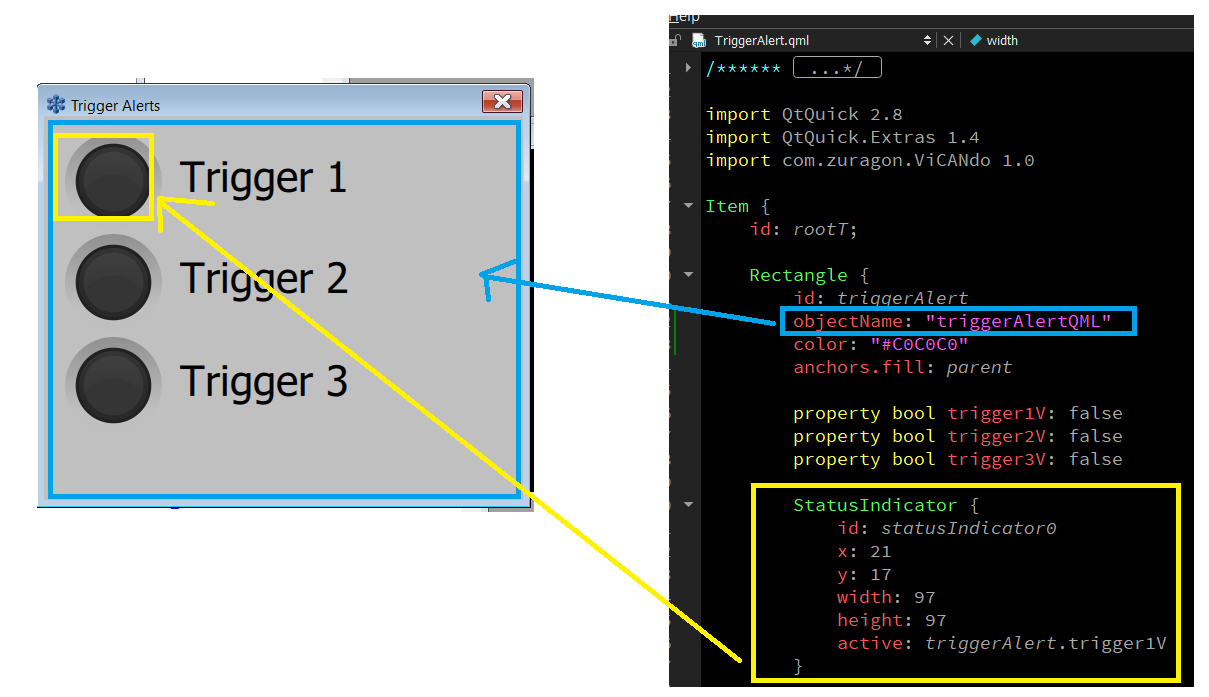
When the trigger condition gets hot, the script will set the active state of the LED to true:
and it will light up the LED:
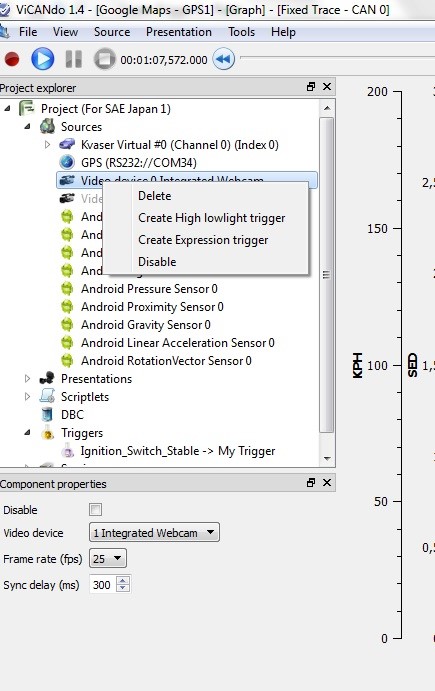
3.12 Optical Triggers
ViCANdo’s version 1.4 brought along with it the possibility of using your camera in order to create triggers. To do so, start by right clicking the source in the project tree.
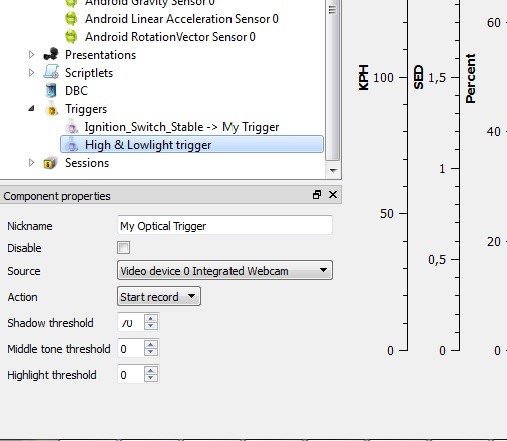
Adjusting the optical conditions where you want the optical trigger to go off can set up the trigger conditions. You can also spend some time with the settings and make the trigger set off in other ways e.g. When an object passes by for a short amount of time.
3.13 Traffic Generator
Sometimes it might be useful to generate your own bus traffic, for this the Traffic Generator comes in handy. The Traffic Generator is a tool that is present under the Tools menu and requires that you have a database connected.
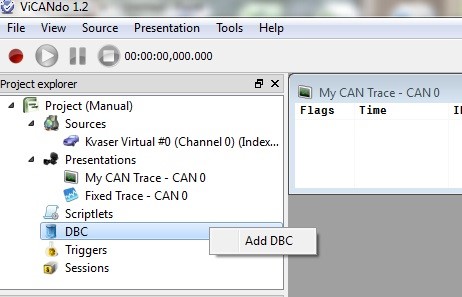
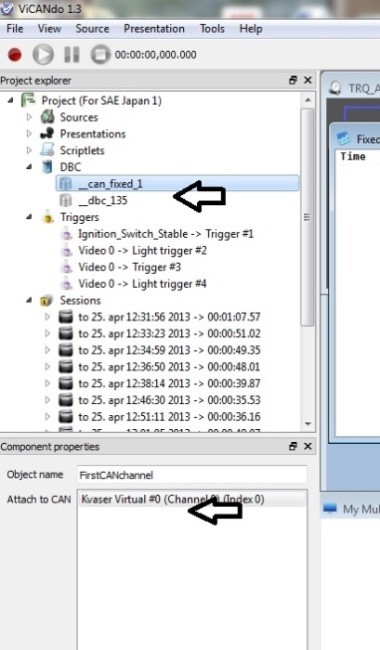
To use this resource you need to associate a database as a global resource by right clicking the DBC icon in the project tree.
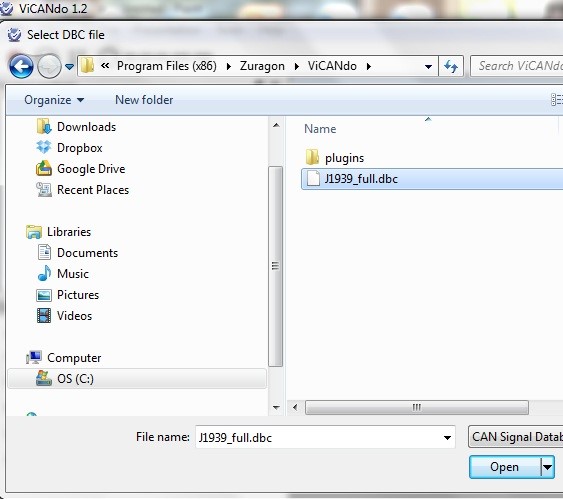
Next, you will have to select a database of your preference.
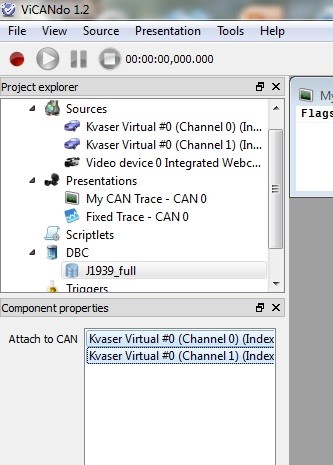
Associate this database with the CAN source where you would like to transmit message. The selected CAN source will be highlighted with blue color. Note: This step is very important. Double check the association of the DBC when you are trying to send message from the database on the Traffic Generator window.
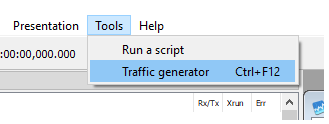
Now, select the Traffic generator option from the Tools menu or press (Ctrl+F12)
Following this, a dialogue box will appear on your screen.
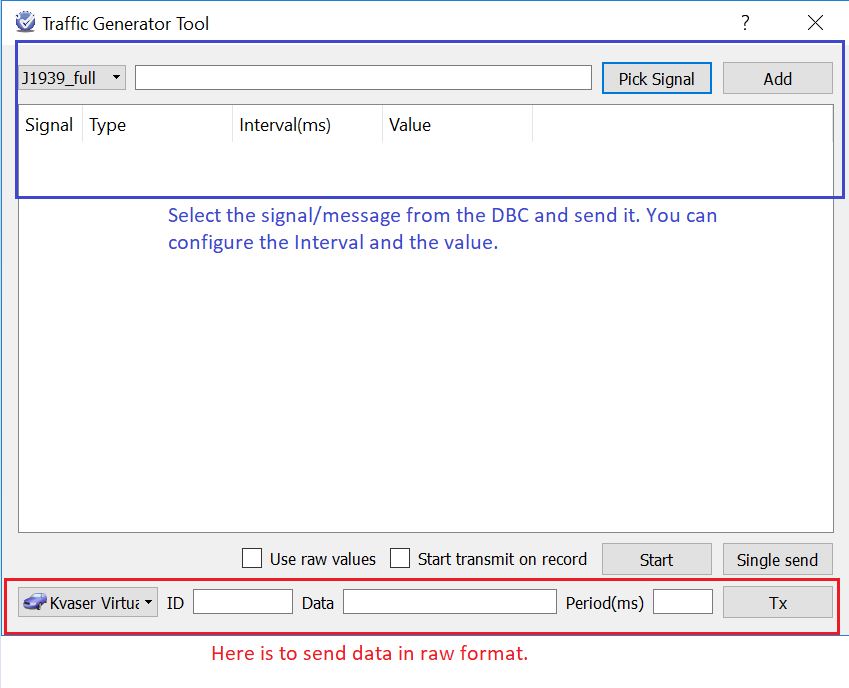
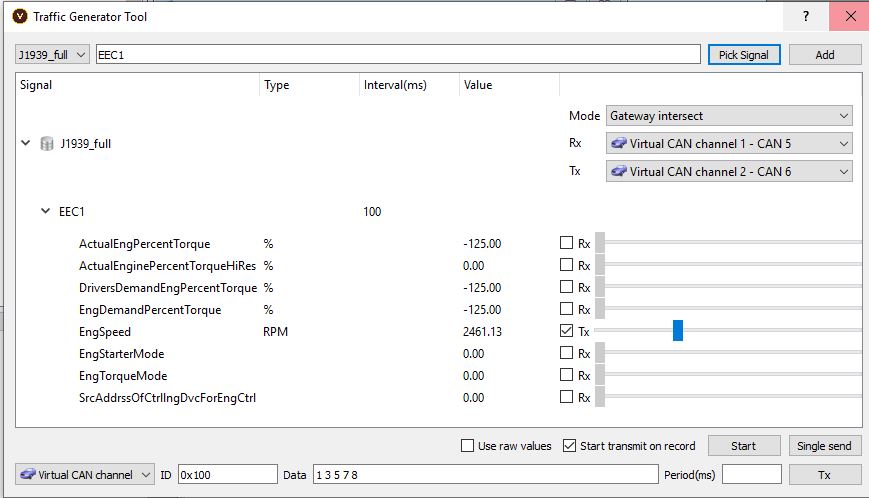
3.13.1 Transmit only
The default mode is “Transmit only” since version 4.0.
The bottom fields are used for sending data in raw format from the selected CAN source. The ID field is for the message ID, it can be decimal or hexadecimal, e.g. 100 or 0x64. For extended ID, just add an x, e.g. 100x or 0x64x. The Data field is for the data of the message, it is like a “list”. The value can be decimal or hexadecimal or mixed. e.g. you can type: 1 0x22 3 0x74 5 6 200 0x18 and then click on Tx button to send. The Period(ms) field is for sending message cyclically. Leave it empty or 0 if you want to send the message only once.
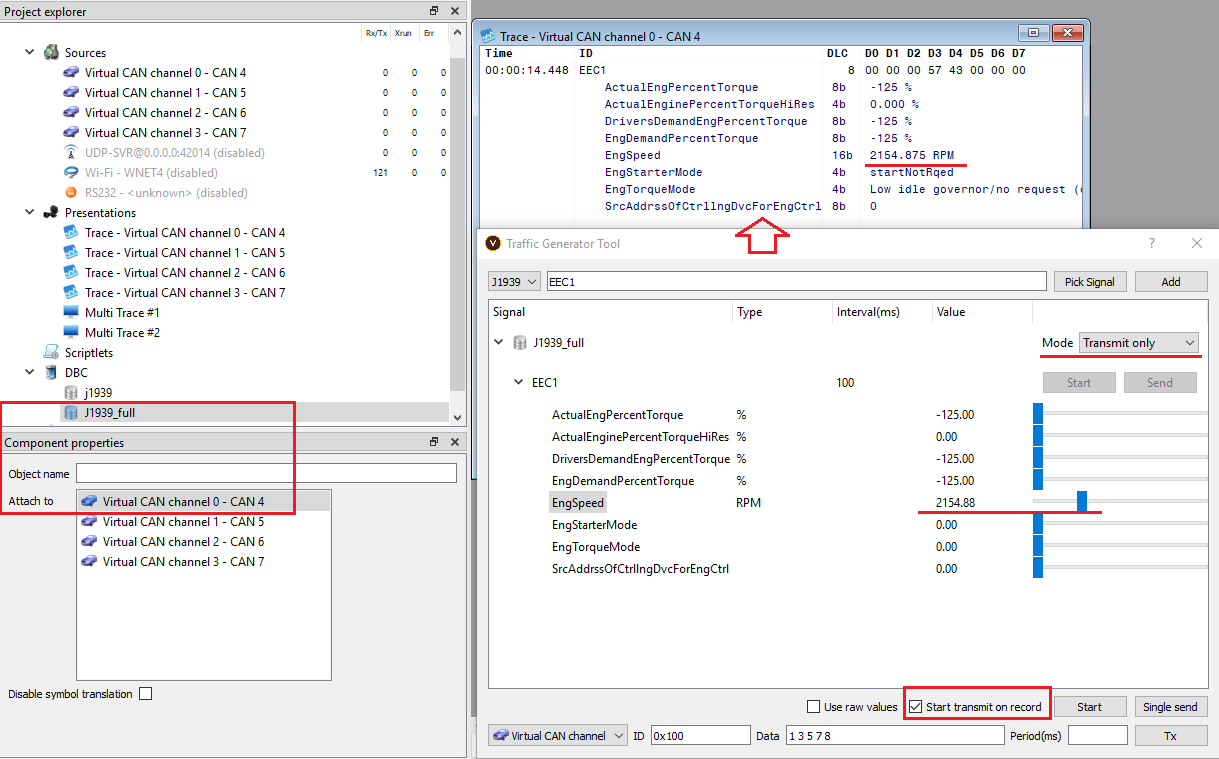
From the top area of the Traffic Generator, you can send a message from the DBC. You need to make sure that the DBC is attached to the source where you want to transmit first. You will have to type in the name of the message that you want to send. ViCANdo will simultaneously search the database and propose probable messages as you type. Most of the times, your typing 1-2 letters is all that is needed.
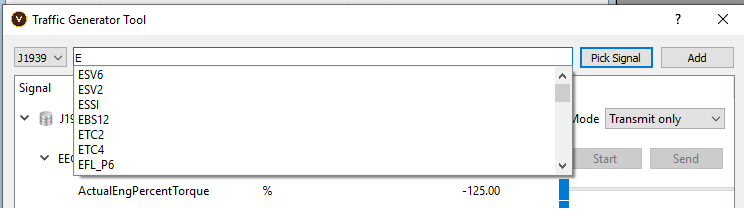
The signals in the message along with their attributes will show up in the dialogue box. A slider is available incase you want to manually change any signal value. However, absolute values can be typed in using the keyboard as well.
You can send message cyclically if the Interval is not 0. Before sending message, you need to make sure the red “Record” button is active and DBC is attached to the source where you want to transmit.
For ease of use, you can also check the “Start transmit on record” option which will start the traffic as soon as you click the red Record button. If the “Use raw values” option is checked, the raw format of the value of the signal will be displayed.
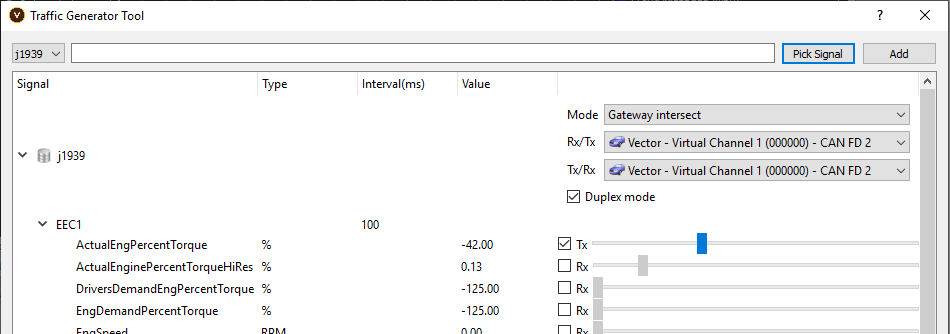
3.13.2 Gateway mode
Since version 4.0, it is possible to use ViCANdo as a gateway - allows you to forward messages from one channel to another.
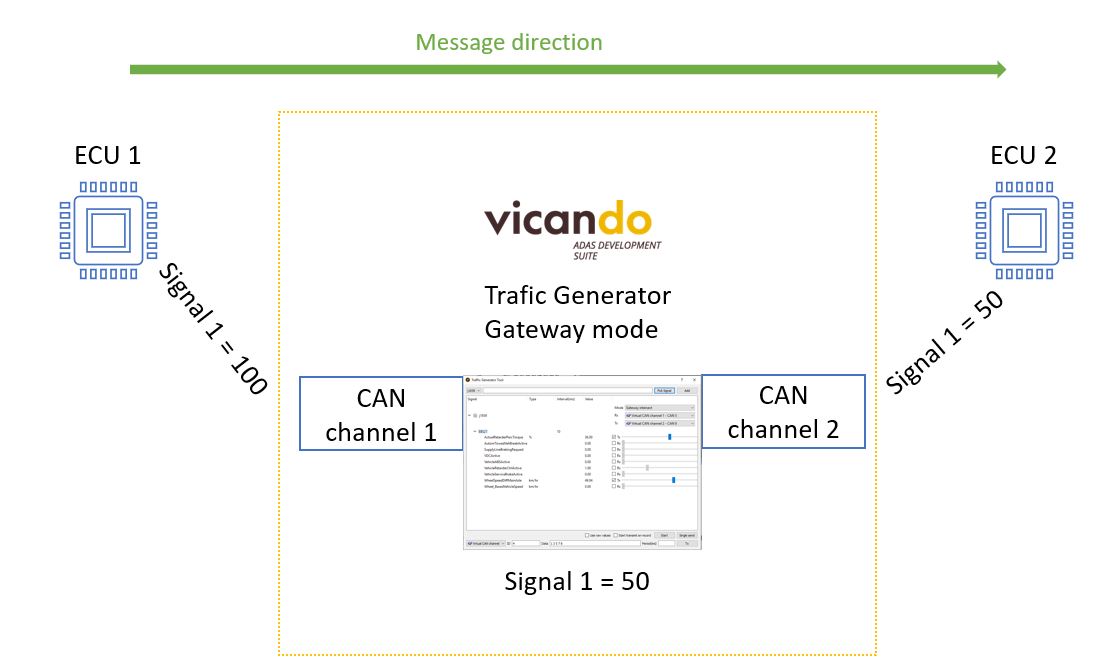
For example, below screenshot shows that when a EEC1 message arrives on channel 1, it will be forwarded to channel 2 and the value of the signal EngSpeed will be changed since it is checked.
If you want to forward messages bidirectionally. You can do this by checking the checkbox of Duplex mode:
3.14 Export of log files with .dbc support
Exporting a log file with .dbc support can sometimes be valuable as it makes it possible to follow one CAN signal through an entire measurement with its real name and value in engineering units.
To begin, before making an export, make sure that you have a proper database associated on the project level and the database has been associated with a proper source (in this case a CAN channel).
Next, right click on the log file to export and give the export result a name.
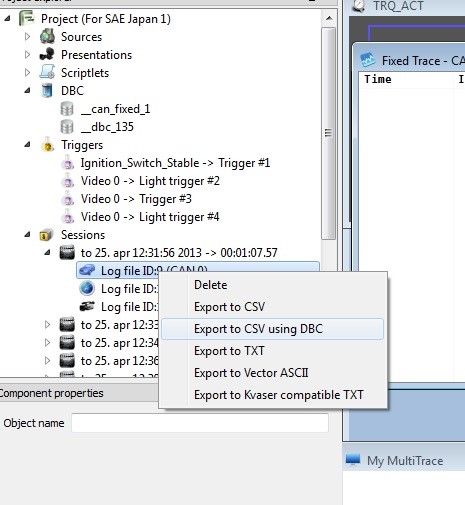
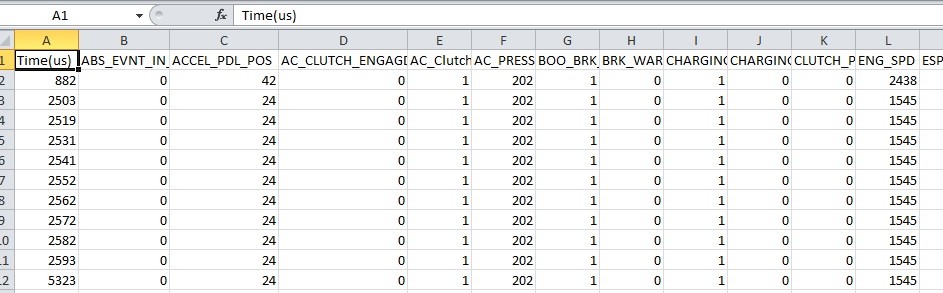
Following this, an excel sheet will open displaying the result as columns in alphabetical order with the signal name on top and the data in engineering units displayed in the order of their time stamps.
3.15 Log markers
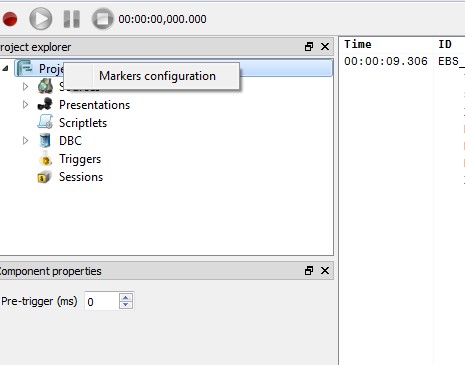
There are times when it is useful to set a log marker in the log file so that we are able to trace back to a certain event. To do so, start by right clicking the Project icon and selecting the markers configuration option.
You will see the following dialogue box on your screen.
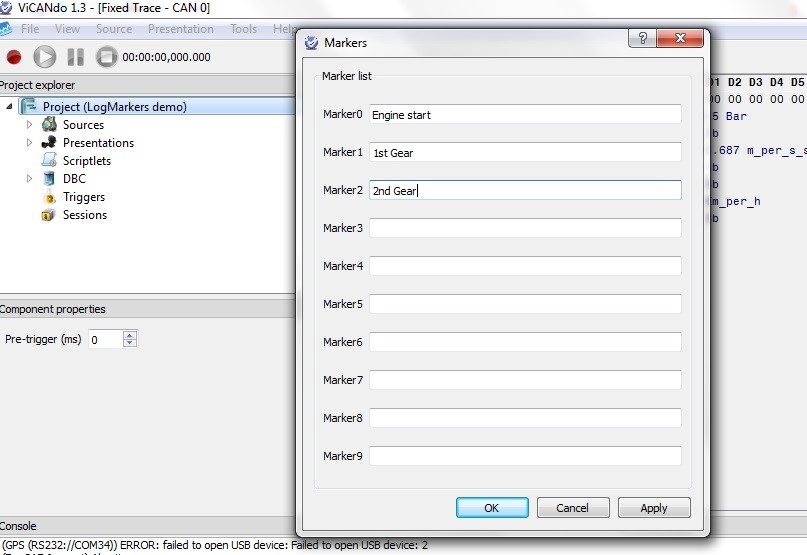
In this dialogue box, you can name your markers according to your preference i.e. Engine Start to indicate that the engine has started at this interval in the log file or 1st gear, 2nd gear and so on.
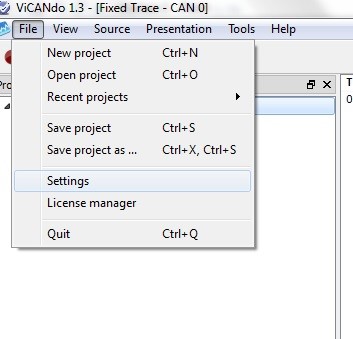
Once you have named your markers, go to the settings menu in order to connect them with a key on the keyboard.
The settings dialogue box is as follows:
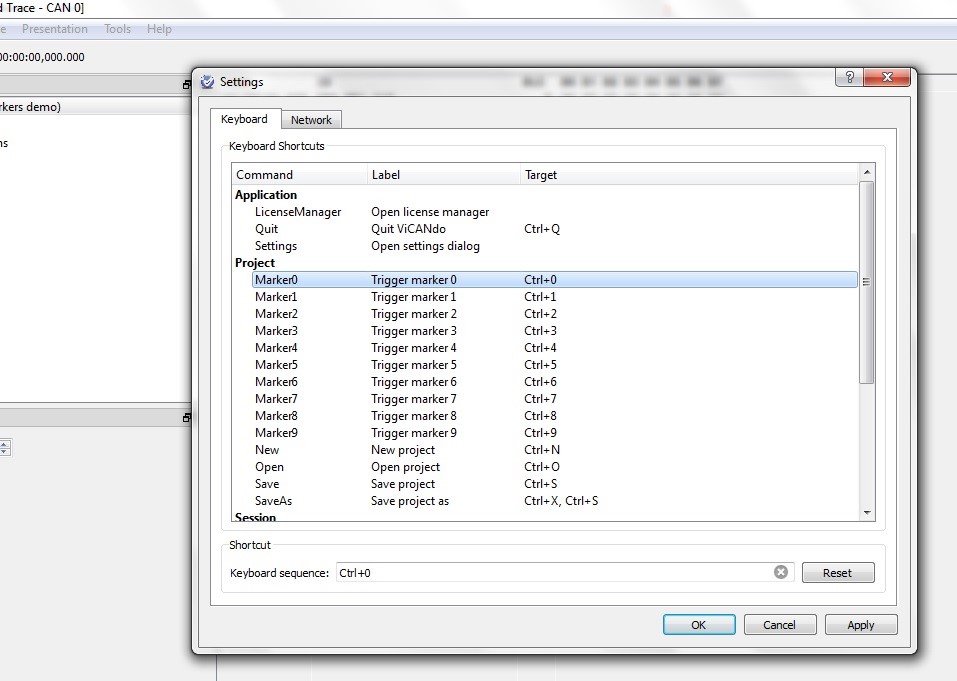
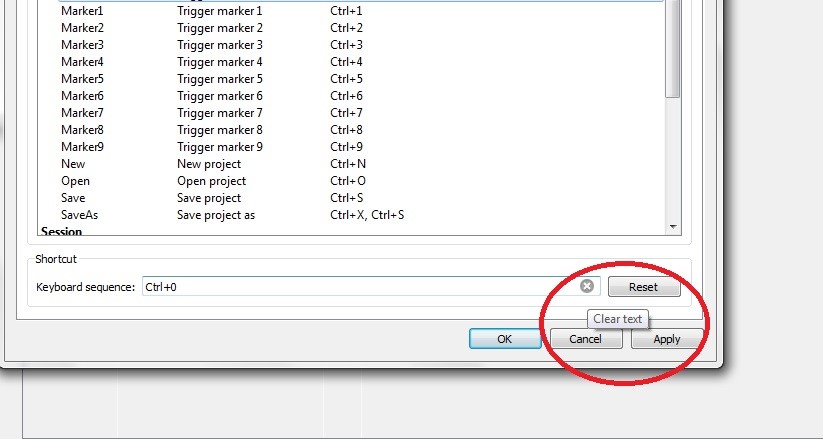
By default, the markers are linked to CTRL+(a digit). However, selecting the clear text button can change this. After this, you can put in the key you want as your log marker activation key.
Such as the return button.
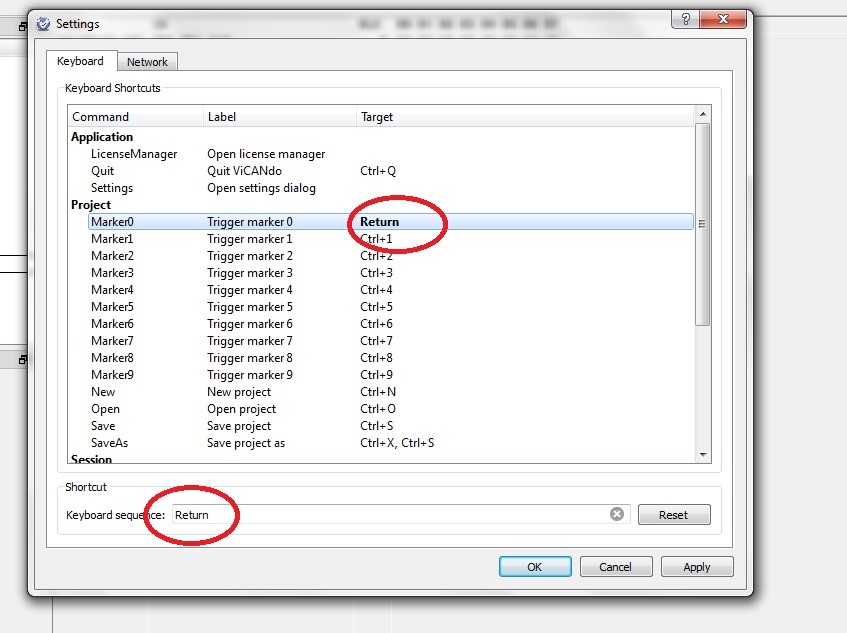
Simply pushing the desired key activates the new log marker activation key. When you satisfied with the configuration of the keys, click on Apply and the saved keys will be active right away.
During run time when a log is active and a log marker key is hit, the log marker will show up in the fixed trace window.
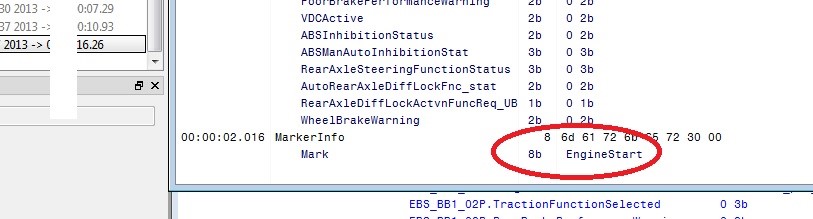
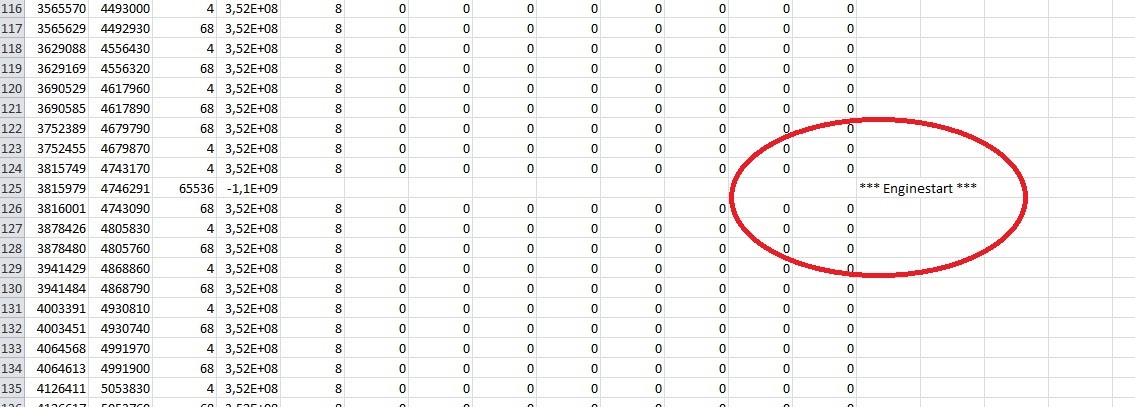
In the log file the marker will show up depending on the export format. For e.g. In the csv format, it will look like this:
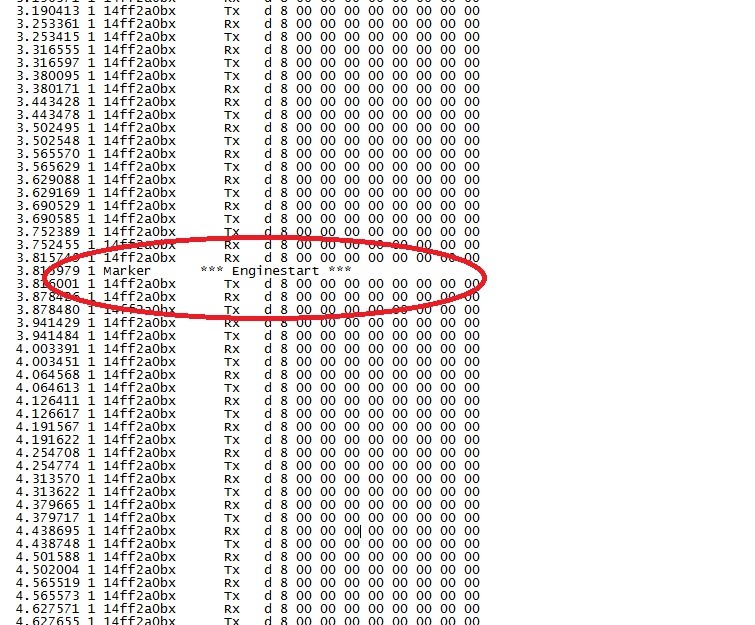
While in the .txt and .asc formats it will show up with its own time stamp like this:
3.16 Replay of CAN log files
To replay a CAN log file you have to put the mouse pointer on the appropriate log file under the right session.
After this, just drag and drop the CAN log file to the appropriate CAN source.
Make sure you are offline before replaying the log file for the first time. You can replay the log file using ordinary options under the CAN source. One thing to keep in mind is that going live on a CAN bus with a log file can be dangerous.
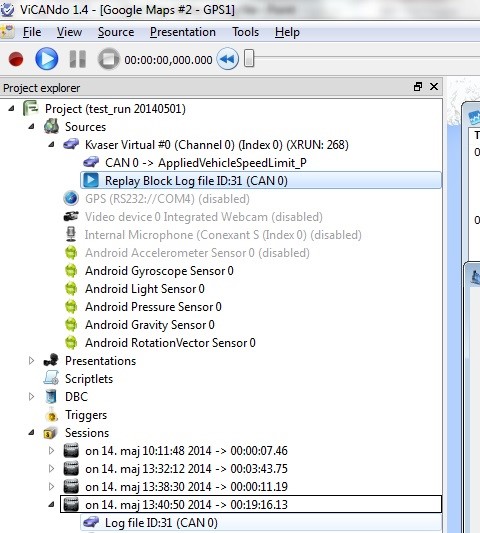
You can activate the replay block by pressing the Record button. This will result in the replay starting automatically once the measurement is active.
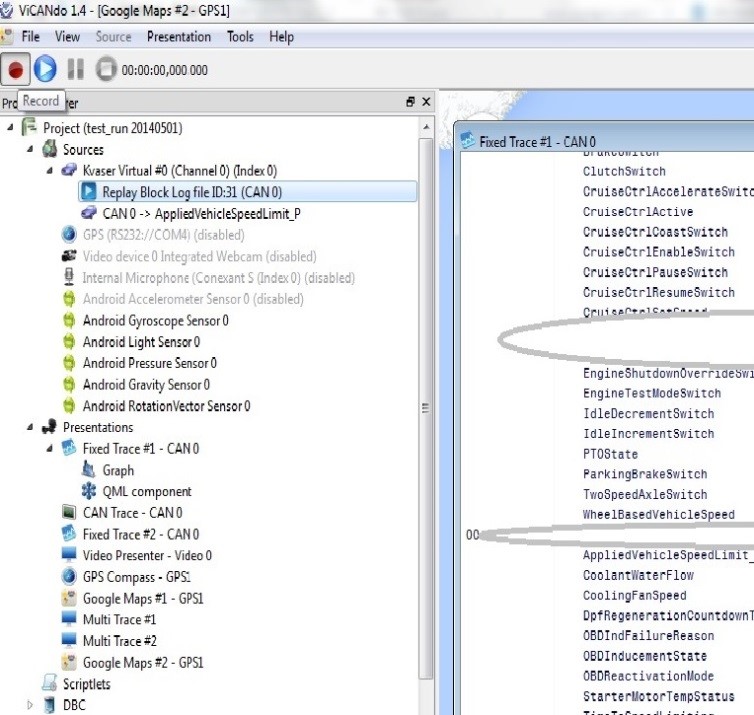
When replaying the replay block, the rest of the ViCANdo CAN functions perform as usual. Graphs and gauges can be picked either from the signal list or from the fixed trace window.
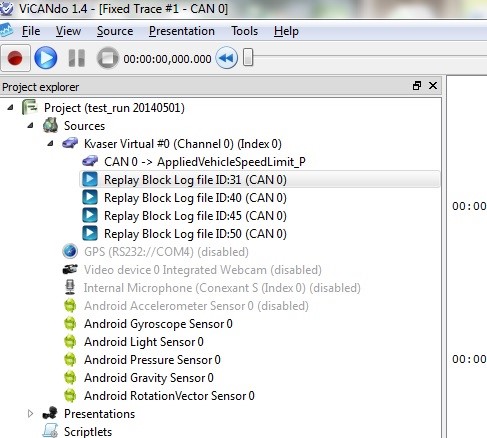
Several replay blocks can be kept under the same source and the traffic from these can also be mixed so that all the active replay blocks will be replayed when the measurement is active.
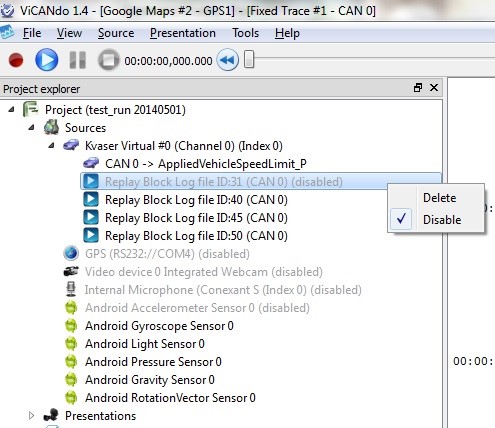
The replay blocks can be disabled or deleted by right clicking on them and selecting the action you want to carry out.
3.17 Offline use of Databases
There are 2 ways of exploring a dbc used in a project - either right click on the fixed trace window where the .dbc is used or use the keyboard (Ctrl+F11).
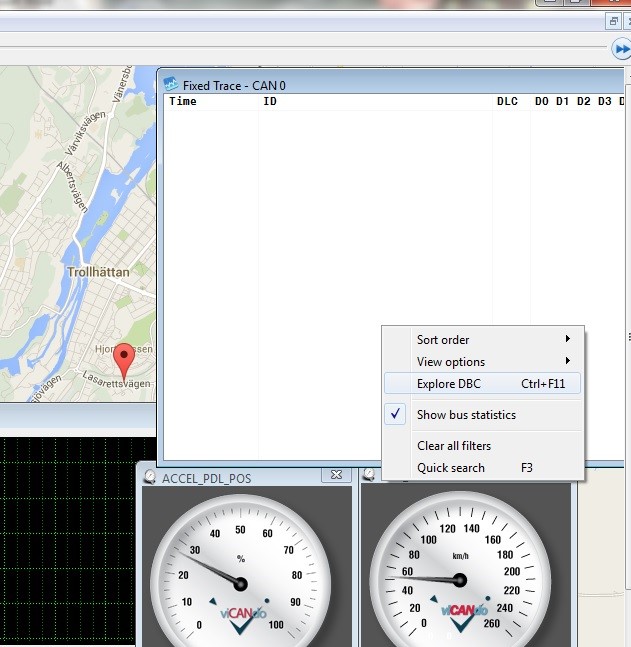
Once you do so the following window will show up:
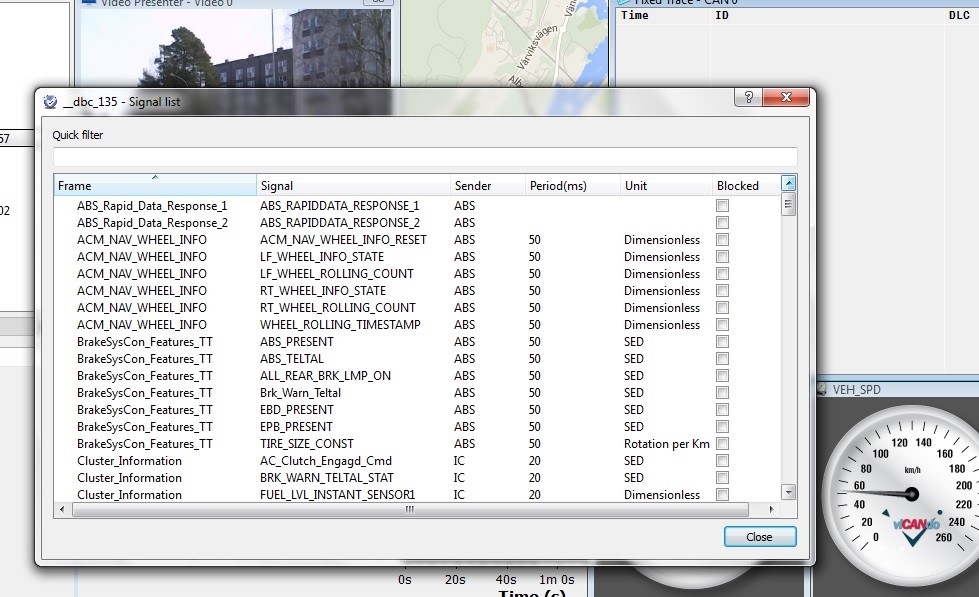
This window contains many features like you can choose to order signals by frame, signal name, sender, periodic time and unit, can filter away signals from your fixed trace window and initiate extended functions by right clicking the signal or the frame where the options show up.
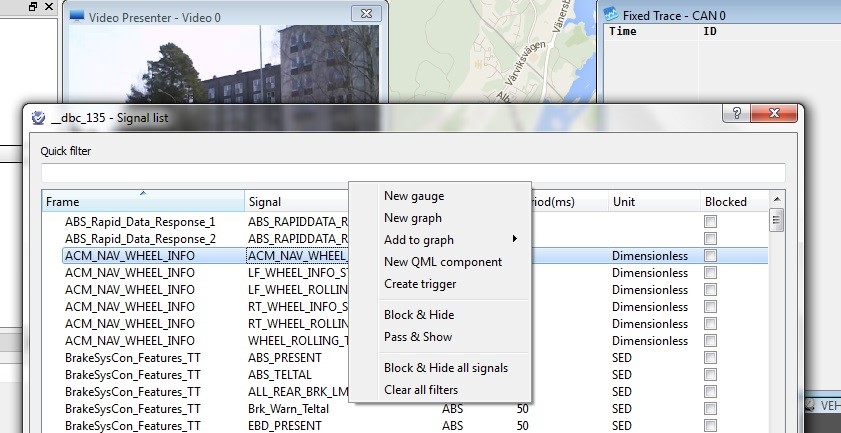
You can also send signals to various display units as triggers or connect them to QML-components.
3.18 Filters in Fixed Trace Window
The sofware was designed to record everything comming from each hardware interface. The “filter” is supported at the presentation level -> in Fixed Trace. This is useful if you are only interested in few signals. It is possible to “hide” the signals you are not interested in the Fixed Trace for sources like CAN, LIN and FlexRay.
While the recording is running or you are playing back the session, you can filter in the fixed trace window directly by right clicking on a particular signal.
If you want to hide many signals, start with right clicking on the “Explore DBC” menu and then right click on the window and select “Block and hide all signals.” Then de-select the signals you are interested.
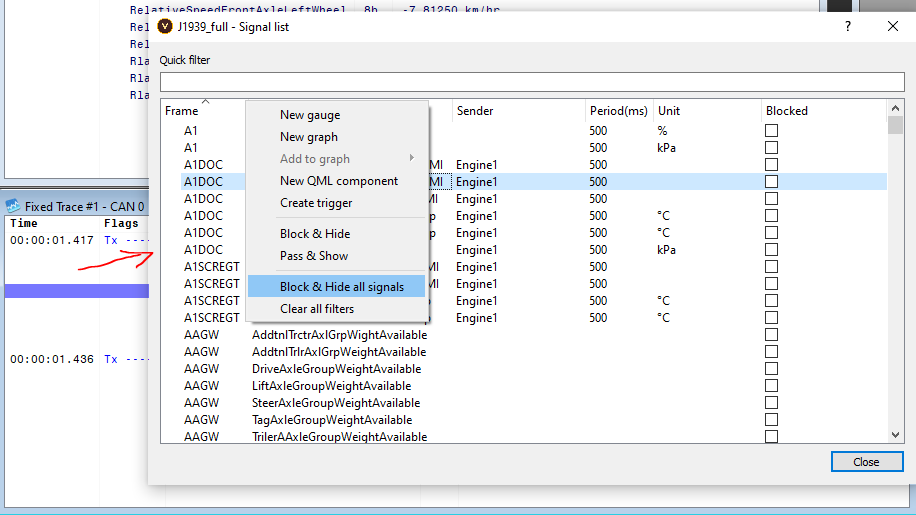
To remove all filter settings, select “Clear all filters”.
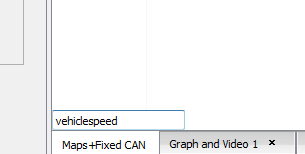
The Quick Search function is also available via a shortcut key (on pressing F3) since version 1.4.
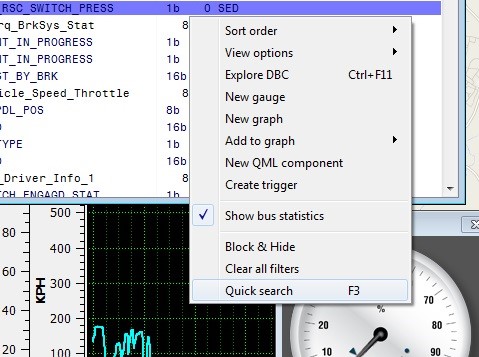
This opens up a small window at the lower left corner of the trace window where you can freely text search.
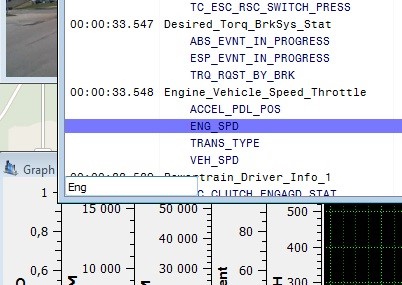
Example – When you type in ‘Eng’, the cursor moves to the first hit containing the letters. After this if you click on the F3 key, the cursor will move to the next hit containing the same letter combination.
3.19 Settings
From Files->Settings you will find the settings of ViCANdo.
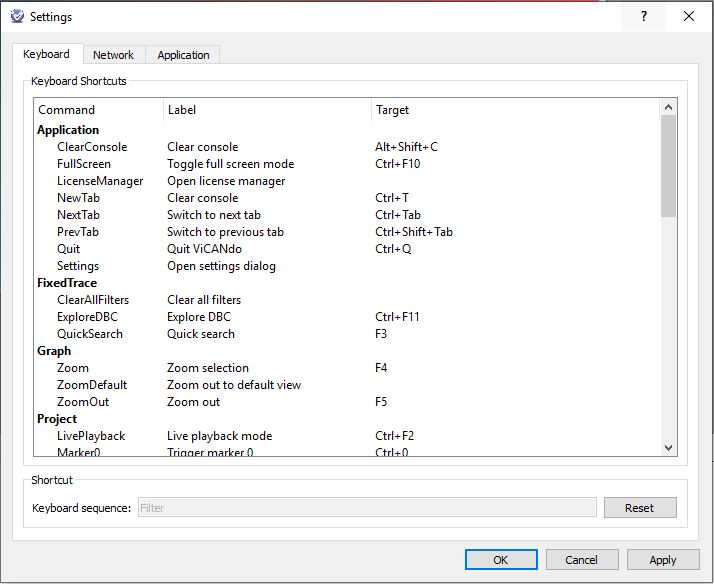
3.19.1 Keyboard shortcuts
Below screenshot is the place to specify the keyboard shortcuts to e.g. menus in ViCANdo:
3.19.2 Network - Configure Proxy
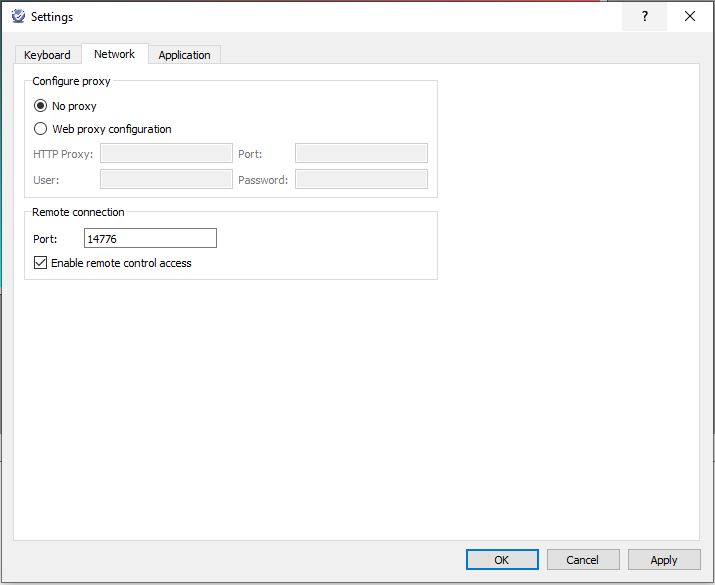
A proxy is required to access the internet sometimes. Configure the proxy in ViCANdo here if you need to access to internet.
3.19.3 Network - Remote connection
Sometimes you might need to remotely control ViCANdo from another application using a TCP socket. An example of this could be when you already have an application in Java or some other language that already does something useful, e.g. reading out a sensor value from an encoder.
The input from an external application can be used to trigger events in ViCANdo that listens on port 14776.
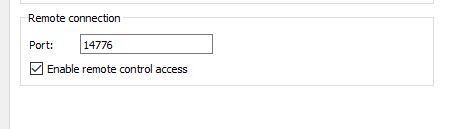
The checkbox needs to be checked and ViCANdo needs to be opened before 3rd party application tries to access.
It is possible to activate the following commands remotely:
- Application.ClearConsole
- Application.LicenseManager
- Application.Quit
- Application.Settings
- FixedTrace.ClearAllFilters
- FixedTrace.ExploreDBC
- FixedTrace.QuickSearch
- Project.Marker0
- Project.Marker1
- Project.Marker2
- Project.Marker3
- Project.Marker4
- Project.Marker5
- Project.Marker6
- Project.Marker7
- Project.Marker8
- Project.Marker9
- Project.New
- Project.Open
- Project.Save
- Project.SaveAs
- Session.Backward
- Session.Forward
- Session.Import
- Session.Pause
- Session.Record
- Session.Search
- Session.Start
- Session.Stop
- Tools.CANTrafficGenerator
These commands can also be combined e.g. Session.Record could be followed by Project Marker0 to put a mark on the log file that the recording started at a particular time due to which a certain event occurred.
Below Python example shows you how to connect the socket, insert 4 log markers to the log file, stop and decouple the socket.
Remote connection example code:
#!/usr/bin/env python
import socket
import time
s = socket.socket(socket.AF_INET, socket.SOCK_STREAM)
s.connect(('127.0.0.1', 14776))
welcome_msg = s.recv(1024);
print "Got '%s'" % welcome_msg.rstrip()

#Click Record
print "Session.Record"
s.send('Session.Record\n')
ok = s.recv(1024)
if ok.rstrip() != "OK":
                print "ERROR: Session.Record command failed"
                exit(-1)
time.sleep(5)  #Wait for ViCANdo to prepare all sources

#Click Start
print "Session.Start"
s.send('Session.Start\n')
ok = s.recv(1024)
if ok.rstrip() != "OK":
                print "ERROR: Session.Start command failed"
                exit(-1)

# Record around 1+4*4 = 17 seconds
time.sleep(1)
s.send('Project.Marker0\n')
ok = s.recv(1024)
if ok.rstrip() != "OK":
                print "ERROR: Project.Marker0 command failed"
                exit(-1)
time.sleep(4)
s.send('Project.Marker1\n')
ok = s.recv(1024)
if ok.rstrip() != "OK":
                print "ERROR: Project.Marker1 command failed"
                exit(-1)
time.sleep(4)
s.send('Project.Marker2\n')
ok = s.recv(1024)
if ok.rstrip() != "OK":
                print "ERROR: Project.Marker2 command failed"
                exit(-1)
time.sleep(4)
s.send('Project.Marker3\n')
ok = s.recv(1024)
if ok.rstrip() != "OK":
                print "ERROR: Project.Marker3 command failed"
                exit(-1)
time.sleep(4)

s.send('Session.Stop\n')
ok = s.recv(1024)
if ok.rstrip() != "OK":
                print "ERROR: Session.Stop command failed"
s.close()
print "Session.Stop"
3.19.4 Application settings
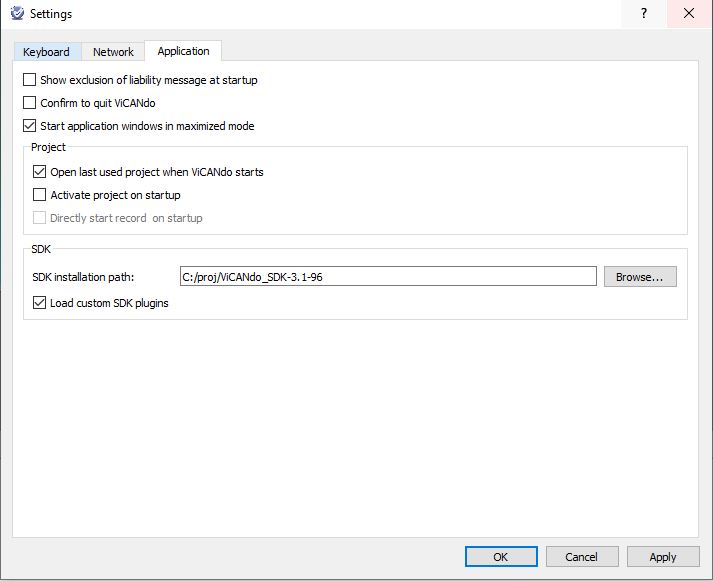
Under Project you can configure e.g. if you want to open the last used project at start up, if you want to active the project at start up.
Under SDK, you can configure the SDK installation path if you have SDK available. Check the checkbox of load custom SDK plugins. It will search for the custom made libraries(presenters, video overlay plugins etc.) from the SDK pathoutputrelease folder when ViCANdo starts next time. Only valid & working plugins can be loaded successfully. You need to release build your customized libraries inside SDK.
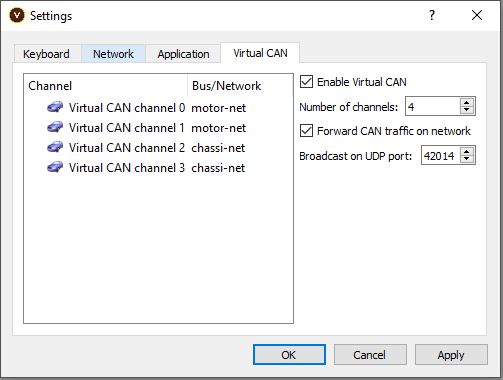
3.19.5 Virtual CAN
Since version 4.0, you can configure how many virtual CAN channels you want to use. It is also possible to transmit CAN messages between virtual CAN channel with same configuration in ViCANdo on two host PC/laptop as long as both PCs are within the same network. This is very useful to test or simulate certial functionality without real CAN hardware.
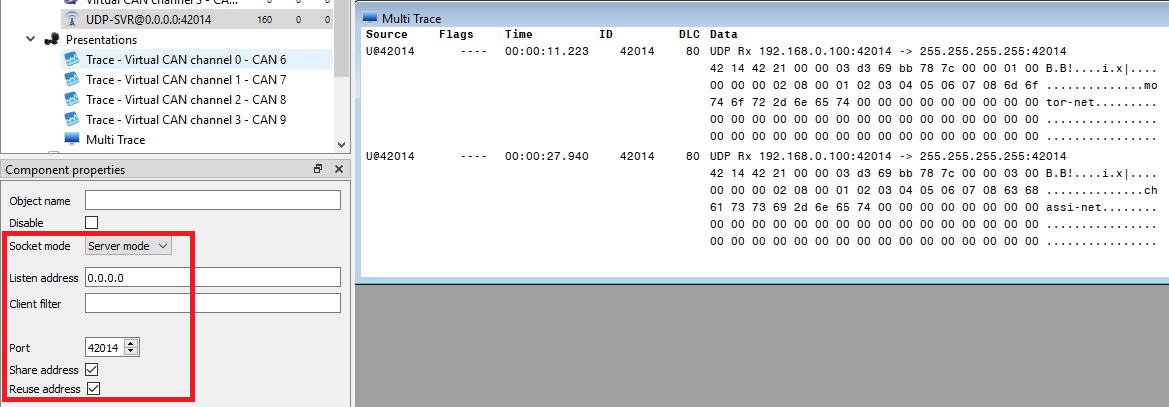
For example, below image shows you the configuration on PC 1 where 4 virtual CAN channels are configured with name motor-net, chassi-net respectively. Also the CAN messages can be broadcasted to ethernet via UDP socket.
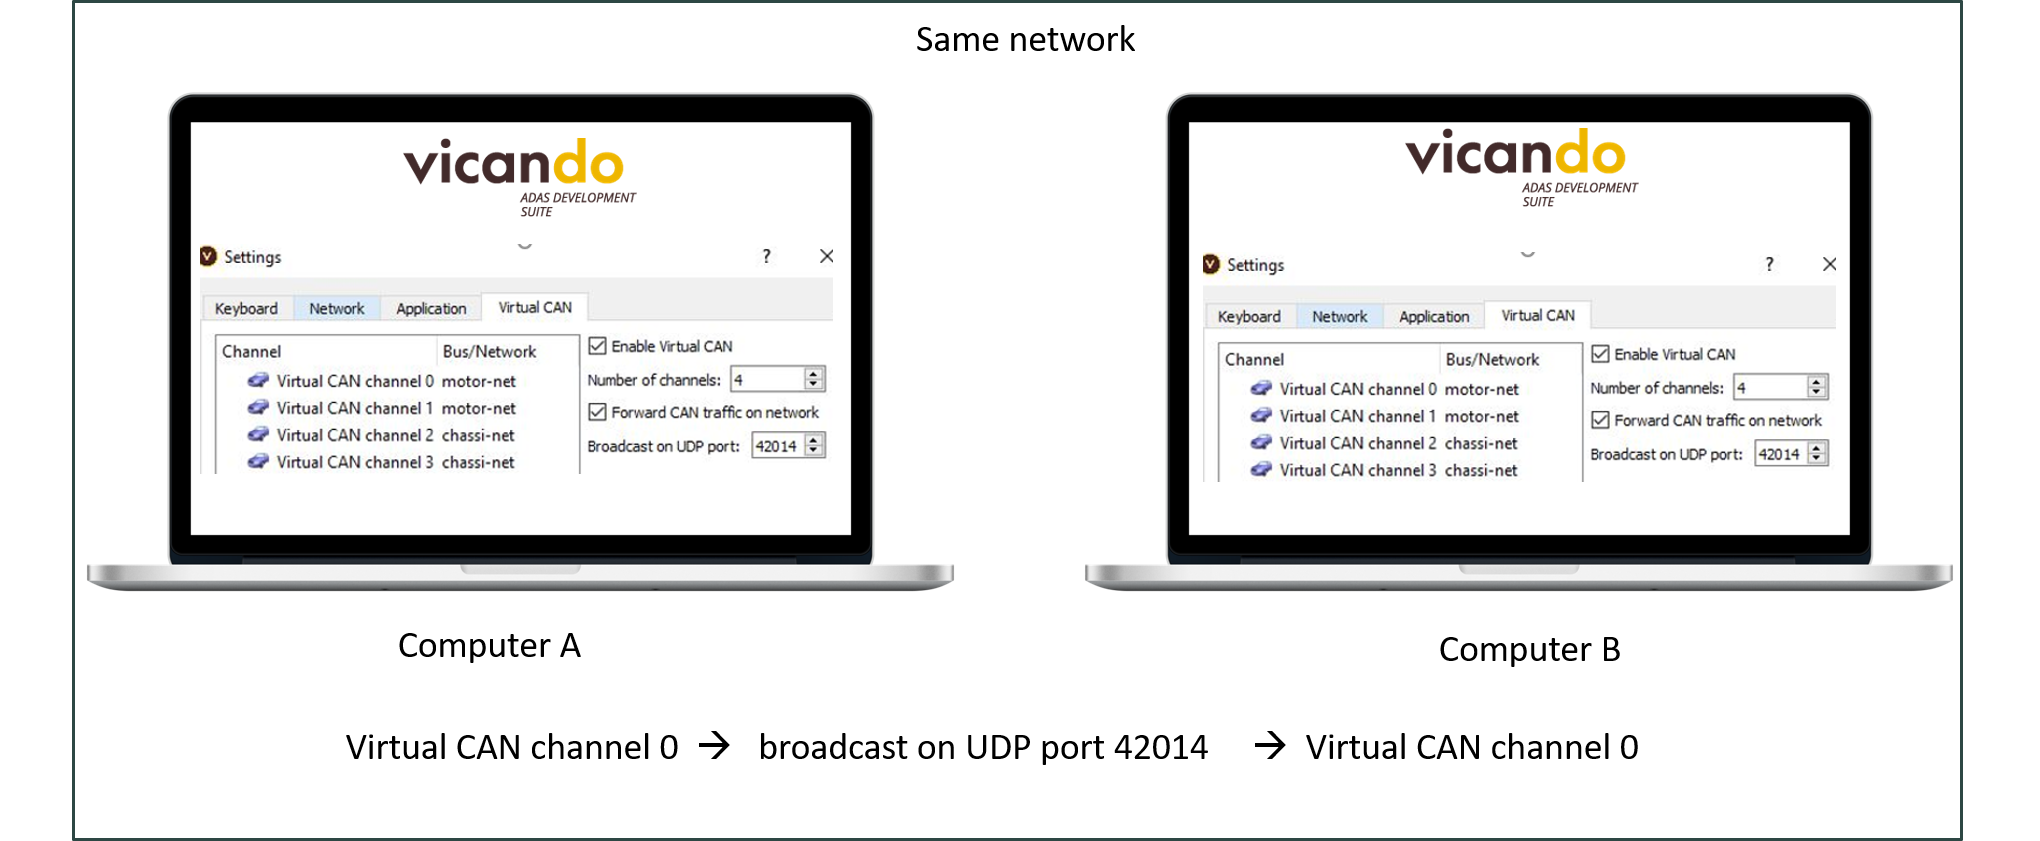
Note
Both ViCANdo should have “Forward CAN traffic on network” enabled and configured to the same port. In case of not receiving messages from UDP, check that firewall is not blocking.
The virutal CAN configuration on PC 2 will need to be the same.
Then we try to use Traffic Generator on PC 2 to send message with ID 0x100 from virtual CAN channel 0, send message with ID 0x300 from virtual CAN channel 3:
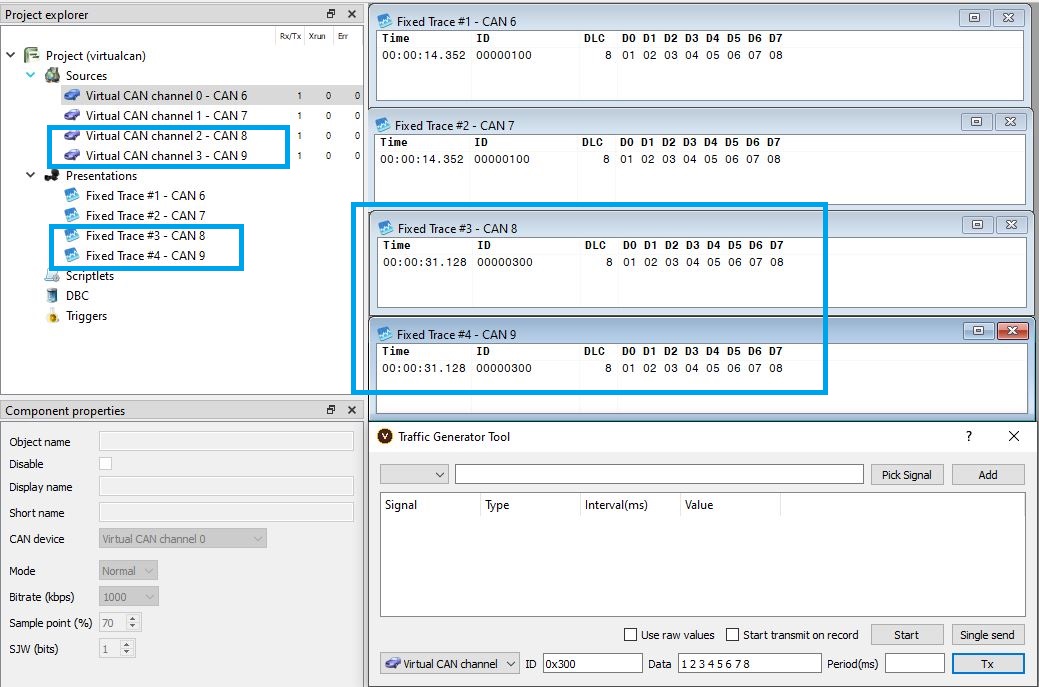
PC 1 will receive the CAN messages on both virutal CAN channels and UDP socket:
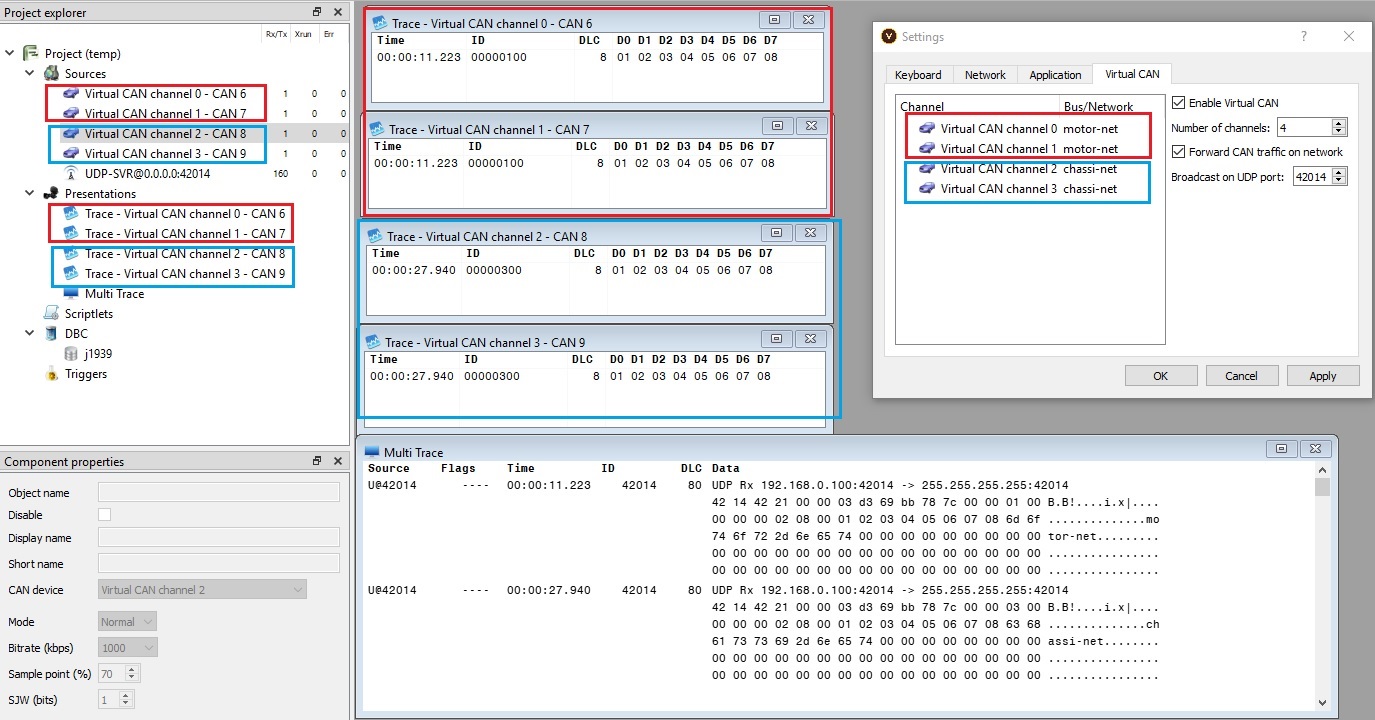
UDP socket source configuration: