4. Advanced Functions
This section lists all the advanced usage of ViCANdo, e.g. how to work with differnet sources and hardware to utilize the power of ViCANdo. All the example projects can be downloaded from here .
4.1 Scripting functions
ViCANdo supports scripting with QML and JavaScript, as well as the Scriplet. It enables you to apply complex logic for the data you received from the source and also send data through the source to the network/field bus the source is connected to.
4.1.1 Using Scriplet
Scriplet is useful in some cases where scripts are simple and performance is not important. Check ViCANdo Scriplet API to learn how to use it. We recommend to use QML & JavaScript instead as Scriplet is obsolete.
4.1.2 Using QML & JavaScript
The most common and advanced scripting function is by using the QML extention in ViCANdo. Check the ViCANdo QML API to learn how to use it.
4.2 Working with bookmarks, session cropping/cutting
4.2.1 Bookmark
Bookmark is an easy to use method to mark the important timestamp with your own free text that describes what has happend at that specific timestamp.
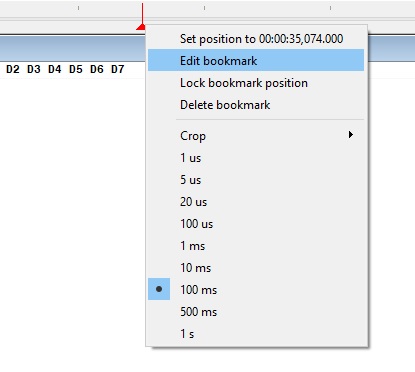
To manually add/edit/remove a bookmark, you need to first select a session, then go to the timeline bar and left click on the point where you want to add a bookmark. After that right click on the bookmark the menu will show and it allows you to edit the bookmark:
Another way to automatically set the bookmark is via the trigger with action set bookmark.
4.2.2 Session cropping
Session cropping in vicando is kinda “soft crop”, it doesn’t really destroy the original session. You can get the short clip/cropped session if you do “clone” of the cropped session.
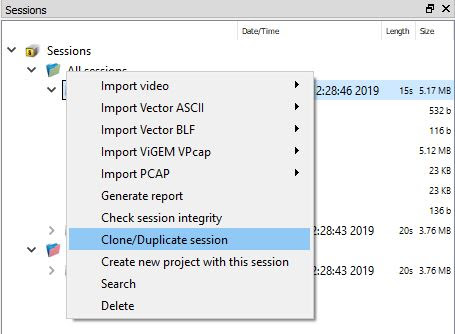
To crop the session, you need to select the sesison, and right click on the timeline bar and set start and stop timestamps via crop menu. Then the session will be marked as “cropped” with a * in the session display name. Then right click on the session and select “Clone/Duplicate session” will create a new session from the cropped session, the new session will be added to the session tree. The new sessions will be added to the folder called cloned-sessions inside the project directory on the disk. The last step is to select on the original session and go to timeline bar and right click and select crop->reset crop.
You can also create an new project from the cropped session. To do this you need to set the start and stop timestamp for your cropping, then right click on the session and select Create new project with this session. The last step is to reset the crop of the original session.
A typical use case is that you crop the session between two bookmarks added by the triggers.
More advanced automatic session cropping can be done from the QML API .
4.3 Advanced search in log files
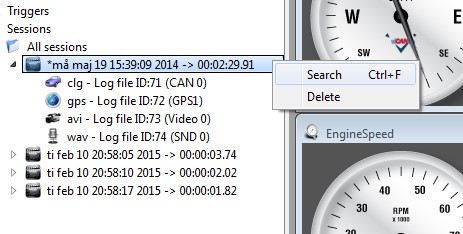
By right clicking Sessions icon and selecting search or pressing the ‘Ctrl+F’ keys, you can perform advanced search in the log files.
When you do so, the following dialogue box will appear which has two modes – a free text search or an expression search.
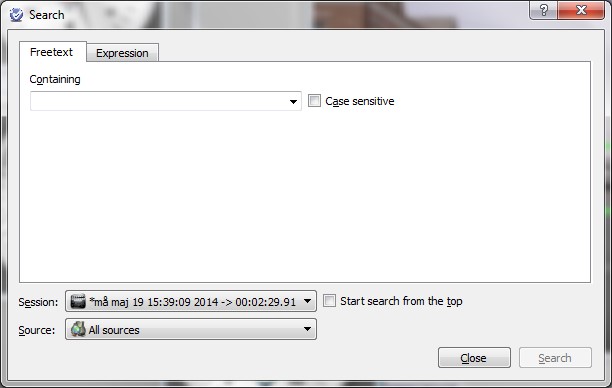
In the free text search, you can search for any word and the closest following 1000 hits as well as following the position of the time stamp pointer will appear.
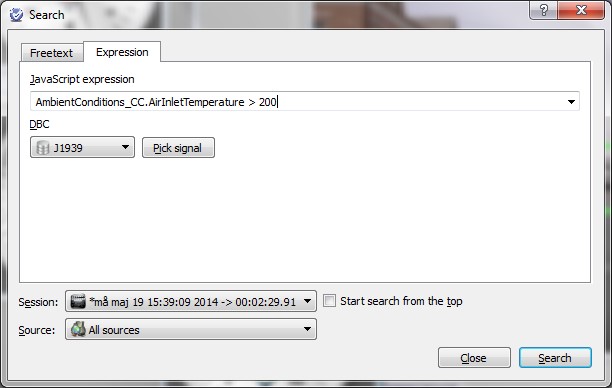
In the expression tab, you can select signals from your database and conditions, like in this case, we wanted values that are larger than 200.
In this dialogue you can also freely program your search criteria using JavaScript. Please consult the JavaScript manual for more details.
4.4 Working with sound sources and FFT analysis
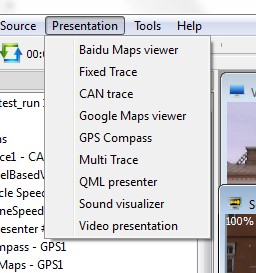
Start off by adding a sound visualizer and associate it with a source.
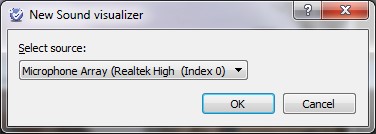
When the source is associated, a sound visualizer will appear as can be seen below:
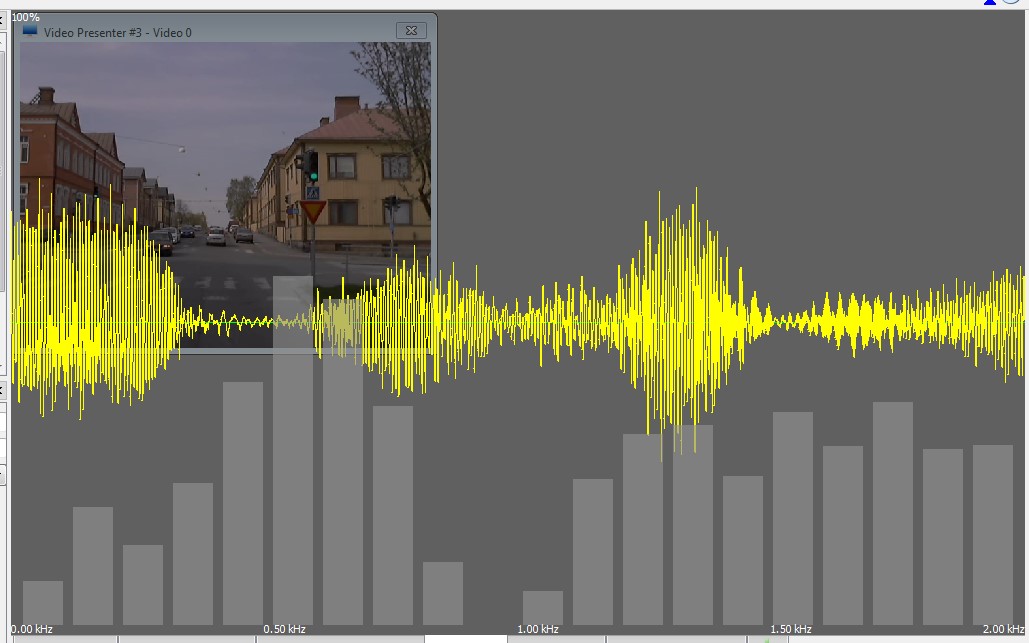
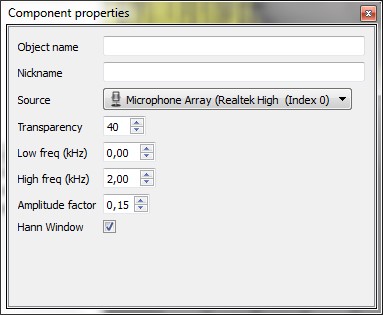
The sound visualizer has a number of settings that can be found under Component properties.
4.5 Working with network cameras
Start of by creating a source for the network camera; this can be done by selecting the Source option on the main menu.
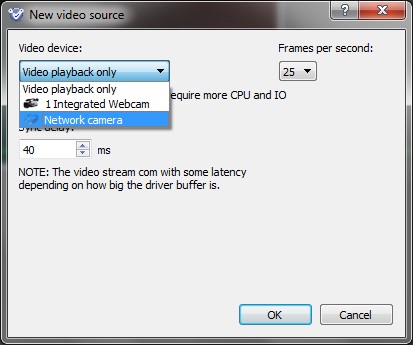
Type in the network URL of your camera and you are ready to go.
For example, below is the typical setting for Axis camera, you need to have the rtsp(real time stream protocol) URL of the camera:
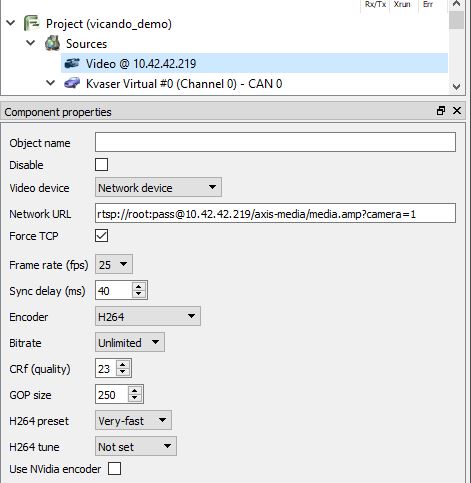
Check the manual of your network camera to learn where to get the network URL.
Note
To get lower latency, try to avoid RTSP and H264, use MJPEG over HTTPS instead.
4.6 Working with GPS and maps
ViCANdo supports any GPS unit with USB and NMEA0183 protocol. Together with viewers in ViCANdo that can display Google Maps® viewer or Baidu Maps®, you can plot the whole route during your test run and analyze the signals in the vehicle afterwords.
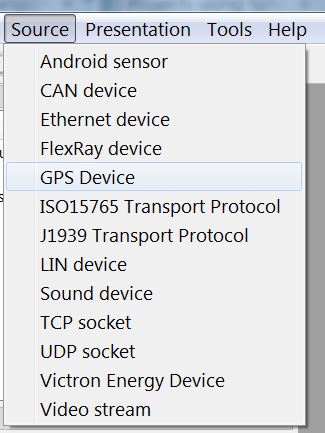
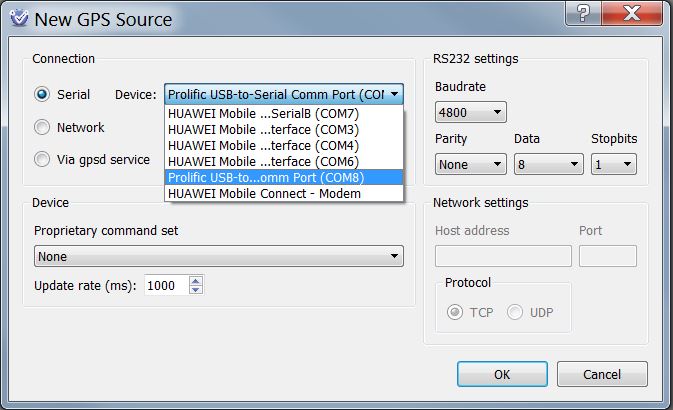
To start working with GPS device, plug in your GPS device to your computer first. Then in ViCANdo select Source -> GPS Device:
In the New GPS Source dialogue, select the GPS device from the list and configure RS232 settings here:
After the GPS source is added, you can also change the settings in Component properties box when you click on the GPS source in project explorer.
Note
By default most GPS device output NMEA data at 1 Hz. It is recommended to pre-configure the GPS device’s output rate using the tools come from the GPS vendor if there are any. If you want to configure the output rate in ViCANdo, you need to know the chipset of the GPS device. Different device use differnet chipset for e.g. output rate settings. If you would like us to add support for configuring your GPS device, contact our sales for more information.
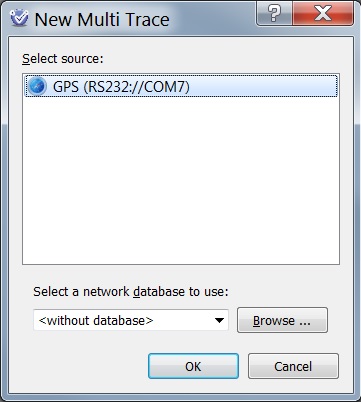
To view the GPS data, a Multi Trace needs to be added from menu Presentation -> Multi Trace. Select the GPS source you have added. You can also set the nickname of the Multi Trace in its Component properties dialogue to a name which is easier to identify the Multi Trace if there are many of them. e.g. nickname of the Multi Trace in this case can be set as GPS.
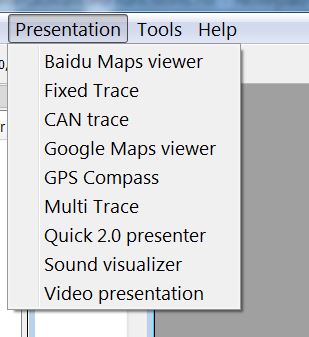
Next is to add Google Maps® or Baidu Maps® viewer from Presentation menu and select the GPS source you have added. If you want, you can also add a GPS compass.
Please note that Baidu Maps® viewer uses a differnet coordinates system called BD09, while Google Maps® uses WGS84. You may need to convert the coordinates system from the Component properties of the Baidu Maps presenter to get correct navigation.
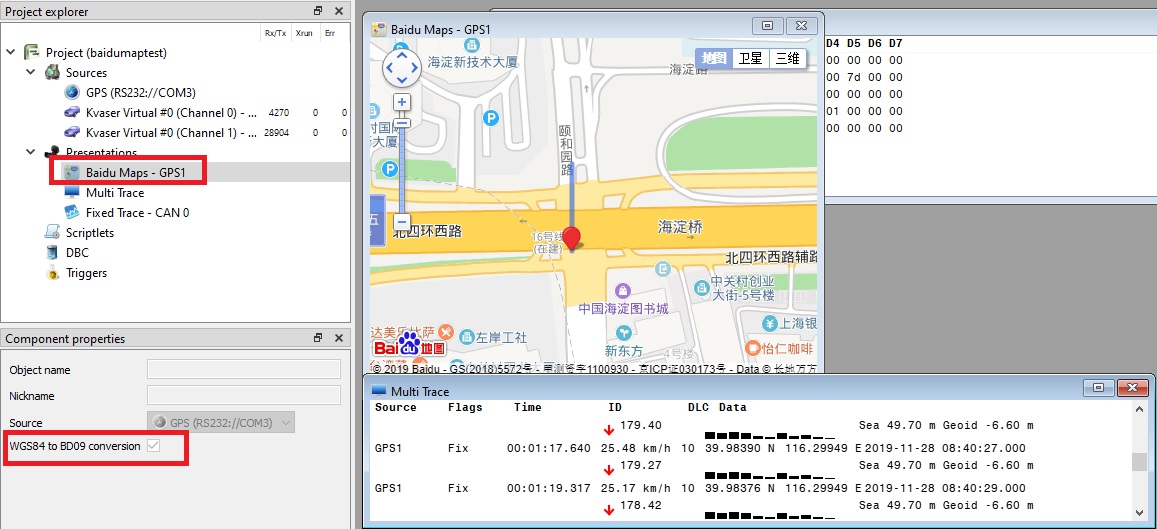
Now you are ready to start recording. The Multi Trace will display the GPS data. For example:
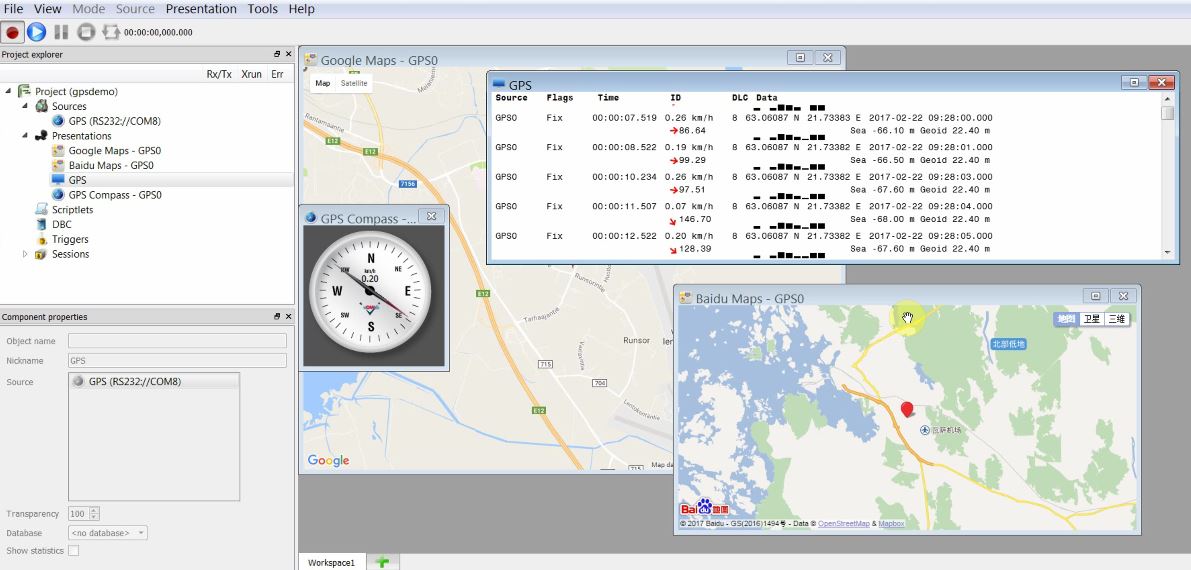
Each GPS data entry in Multi Trace has two rows. First row contains:
- GPS Source
- Fix - means GPS fix quality in NMEA
- Timestamp in microsecond
- Speed in km/h
- Number of satellites being tracked
- Lattitude
- Longitude
- GPS date and time
The second row contains:
- Bearing in degrees
- Antenna signal strength for each satellite
- Sea level altitude in meters
- Geoid level altitude in meters
4.7 Working with GPSD
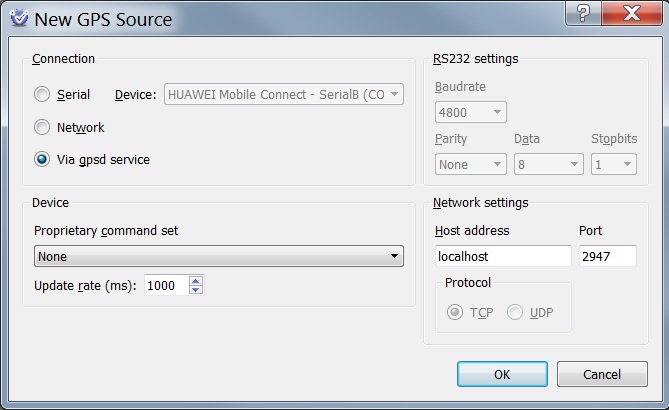
Start of by creating a source for GPSD that can be found under the Source option on the main menu: Source-> GPS Device
Then in the New GPS Source dialogue, select Via GPSD service. Then you can type in the server parameters necessary for your GPSD device(s).
4.8 Working with Ethernet
ViCANdo allows you to work with Ethernet. Make sure that ViCANdo does not be shielded by firewall in the computer.
For Mac OSX Users
If you need to use the Ethernet source(including TCP/UDP sockets) on your Mac, permission to capture network traffic should be given to ViCANdo. To resolve this, you can either enable “root” user on your Mac or execute below command in terminal:
sudo chmod o+r /dev/bpf*
which will allow any user on your machine to sniff packets.
For Windows OS Users
To use the ViCANdo Ethernet option on Windows OS, your computer needs to have PCAP(packet capture) driver installed.
Downlad PCAP driver, e.g. WinPcap from: https://www.winpcap.org/install/default.htm
Note
- If your license includes Ethernet option but ViCANdo doesn’t display it from the menu. Please download and install the PCAP driver and restart ViCANdo.
- ViCANdo currently only supports UDP and TCP level of Ethernet.
Open ViCANdo, add an Ethernet device from Source menu.
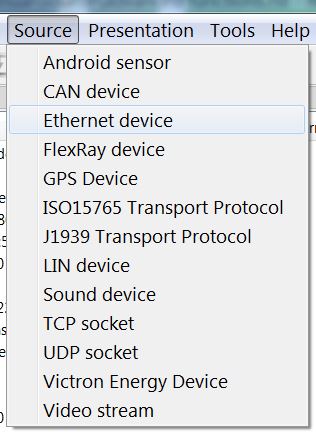
Select the Etherent device from the list:
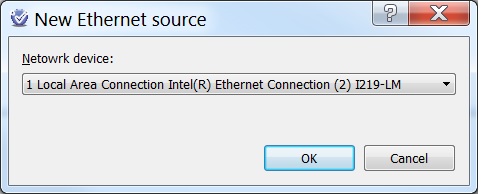
When the Ethernet device is added, click on it and you will see the Component properties dialogue on the left where you can change the configuration of the Ethernet device.
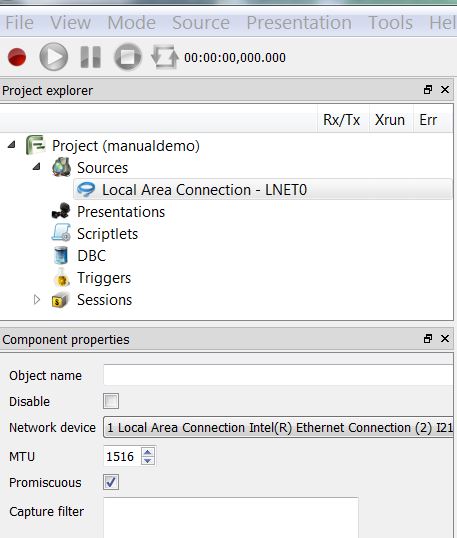
The Capture filter is the place to add the PCAP filters which can be used to capture the wanted traffic.
In ViCANdo, Multi Trace is used for displaying Ethernet traffic. Add a Multi Trace from Presentation menu and select the Etherent device in-use.
Now you are ready to start recording. For eaxmple, below is the Ethernet traffic in Multi Trace without any PCAP filters:
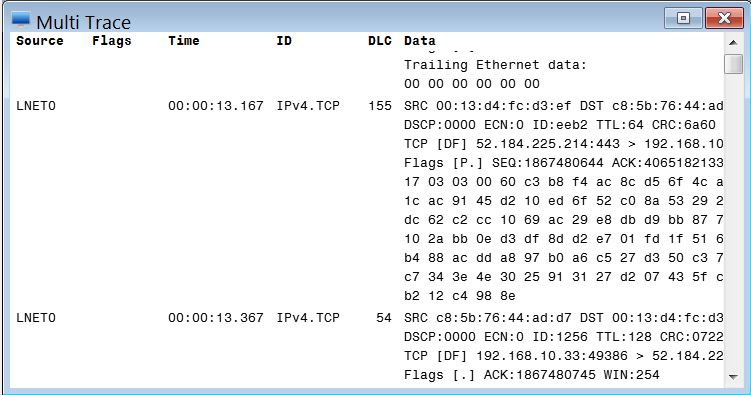
If you would like to add PCAP filter, just type the filter command in Component properties dialogue of the Etherent source and re-start recording. Then the Milti Trace will only display the traffic you are intrested in. For example:
- Filter tcp will make Multi Trace display only the TCP traffic.
- Filter udp will make the trace display only UDP traffic.
- Filter port 80 will make the trace display only the traffic on port 80.
For more syntax examples, refer to tcpdump http://www.tcpdump.org/manpages/pcap-filter.7.html
4.9 Working with TCP and UDP Socket
ViCANdo has two modes:
- Spy mode - Spy on TCP or UDP traffic, extract TCP or UDP data from raw Ethernet frame
- Client/Server mode - Use ViCANdo as a TCP or UDP client or server
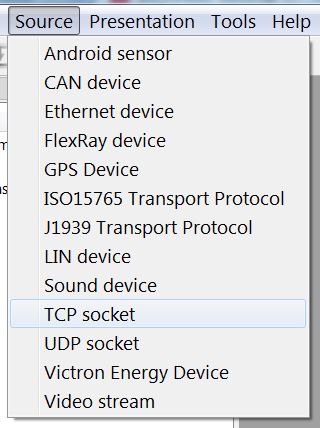
4.9.1 TCP socket - Spy mode
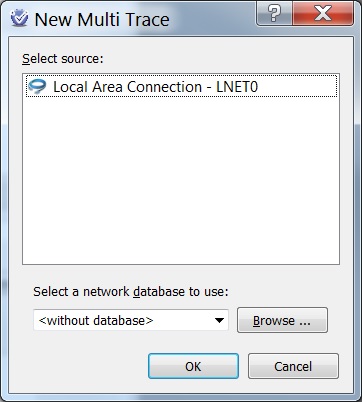
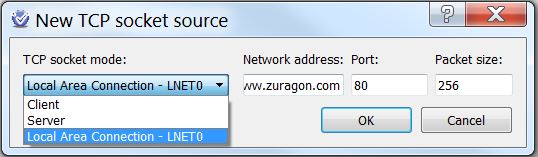
You need to have a Ethernet source(better to have a Multi Trace as well) added in ViCANdo first. Then go to Source menu to add a TCP or UDP socket:
For example, below is a screenshot when adding the TCP socket, you need to select the Ethernet source from the drop-down list if you want to use the spy mode. Then configure the network address, the port number and the package size.
Then under the Ethernet source in project explorer, you will find the TCP socket you have added. e.g. TCP:80 in below example.
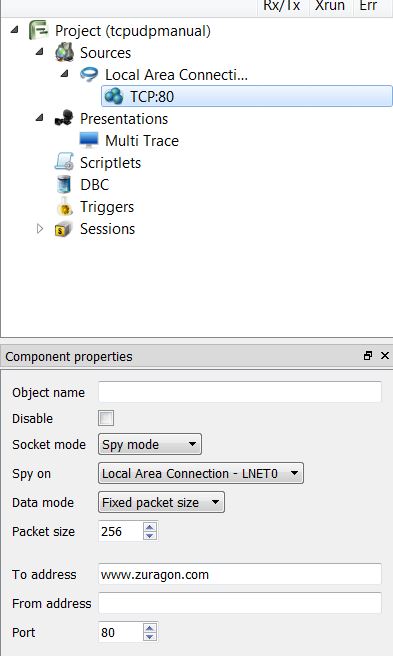
You can also change the configuration of the TCP socket in the Component properties dialogue when you click on the TCP source. e.g. Data mode can be changed to Text data where traffic will be displayed in text data mode.
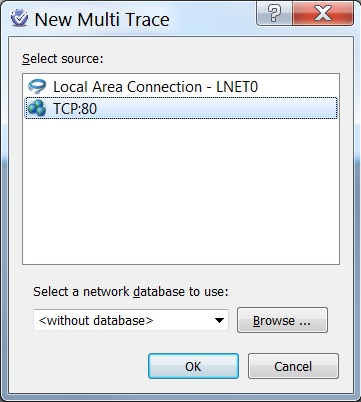
You need a Multi Trace to view the TCP traffic. When adding the Multi Trace from Presentation menu, select the TCP source you have added.
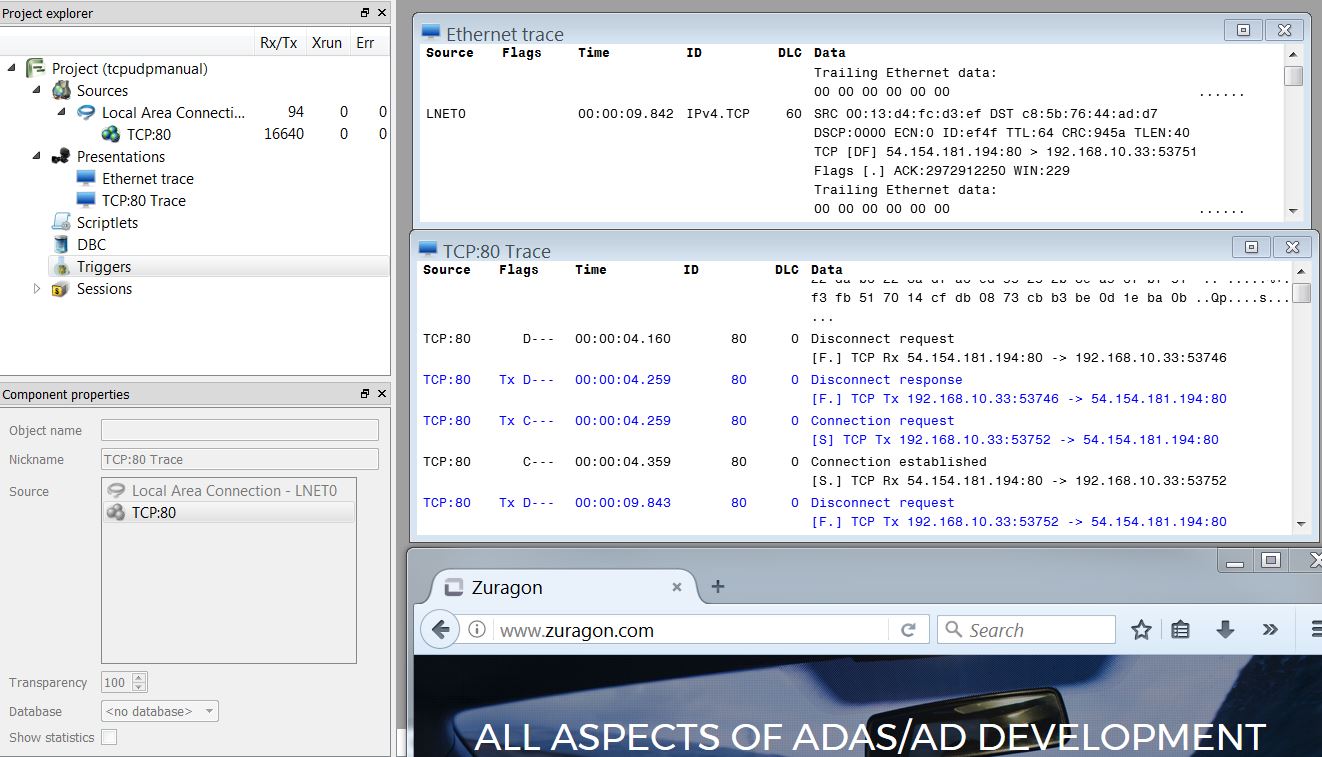
Now you are ready to start recording the TCP traffic on port 80.
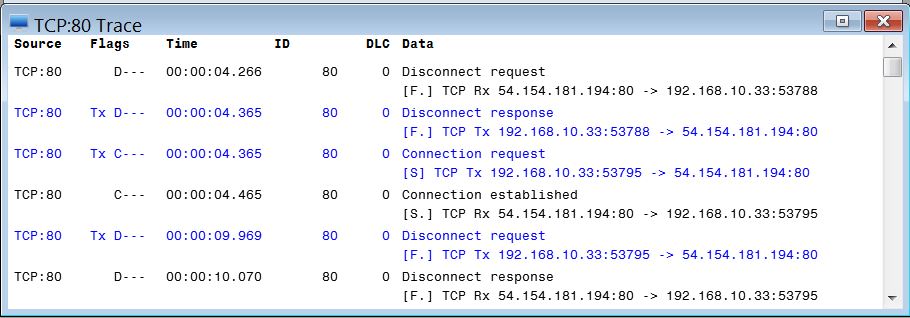
In this example, we need to open web browser and go to www.zuragon.com to generate some traffic on port 80. Then the TCP traffic(default fixed packet size data mode)will be displayed:
To change the Data mode, stop recording and click on the TCP:80 source and change the Data mode to Text data in Component properties dialogue. Then restart recording, the TCP traffic will be displayed in text data mode. For example:
4.9.2 TCP socket - Server mode
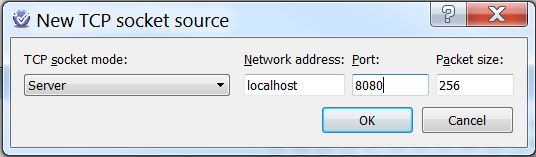
To use ViCANdo as a TCP server, you need to add a TCP socket from Source menu and configure it, for example:
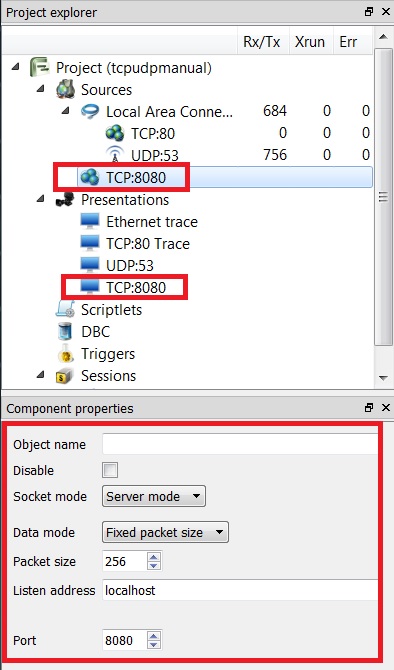
and also a Multi Trace for displaying the traffic. For example, below is the configured TCP socket in server mode and a Multi Trace:
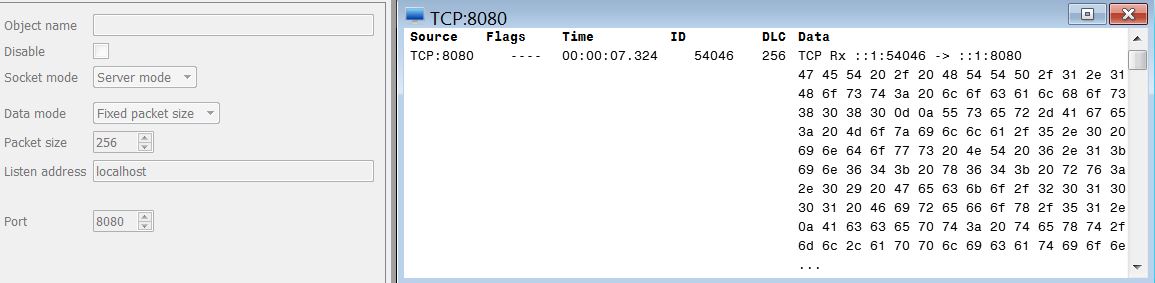
In this example, start recording in ViCANdo, and then we need to open web broswer and go to http://localhost:8080 to see what the web broswer is trying to do. For example:
4.9.3 TCP socket - Client mode
To use ViCANdo as a TCP client, you need to add a TCP socket from Source menu and configure it, for example:
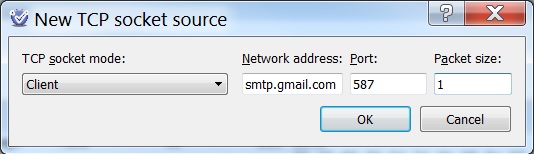
and also a Multi Trace for dislaying the traffic. Now you are ready to start recording in ViCANdo. Below is the screenshot when Data mode is set to Text data:
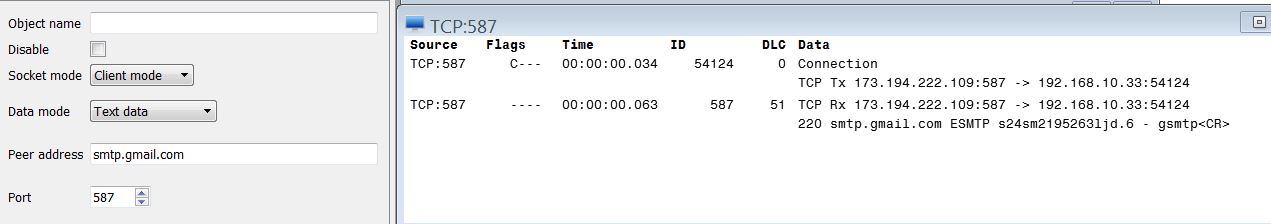
As you can see from above screenshot, the welcome message from Google’s STMP is displayed.
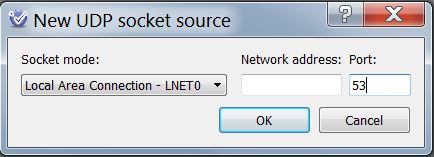
4.9.4 UDP socket - Spy mode
Similar to TCP socket, you need to add a UDP socket and a Multi Trace for it. Let’s sniff on DNS on port 53 now. When adding the UDP socket from the Source menu, configure the port to 53:
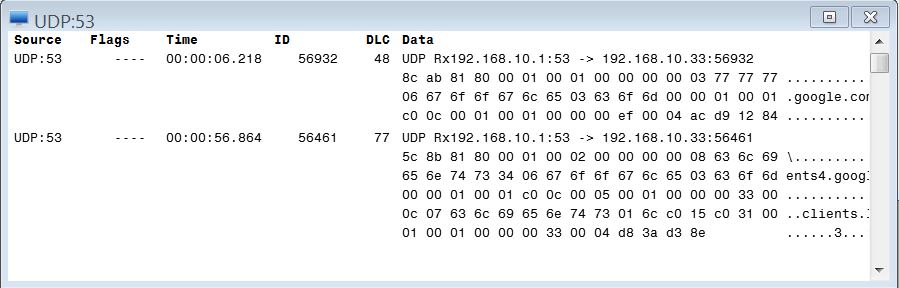
Then add a Multi Trace for the UDP:53 and set the nickname of the Multi Trace to UDP:53. Now you are ready to start recording in ViCANdo.
Now open command prompt if you have Windows OS to trigger a DNS reslove to see the traffic in UDP:53 Multi Trace.
For example, type below command in command prompt:
ping www.google.com
Then you will see the UDP traffic on port 53 in Multi Trace.
4.10 Working with FlexRay
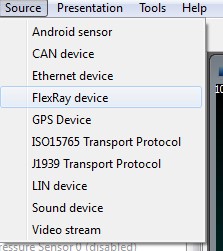
Start by creating a source for the FlexRay device, this can be done by selecting the Source option available in the main menu.
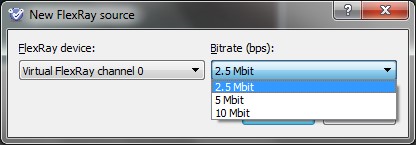
Next, choose the device and set the bitrate.
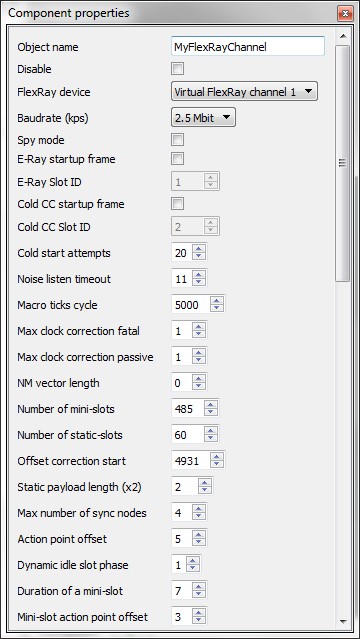
The settings for each FlexRay channel are available under component properties.
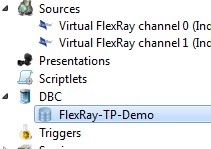
Just as is required with CAN and LIN, you have to associate this with a suitable database as well.
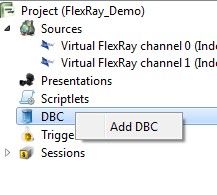
In this case we choose a Fibex file, however, it can be a .dbc file as well.
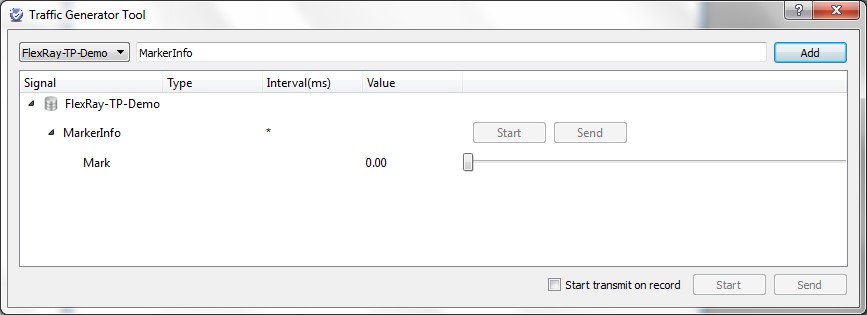
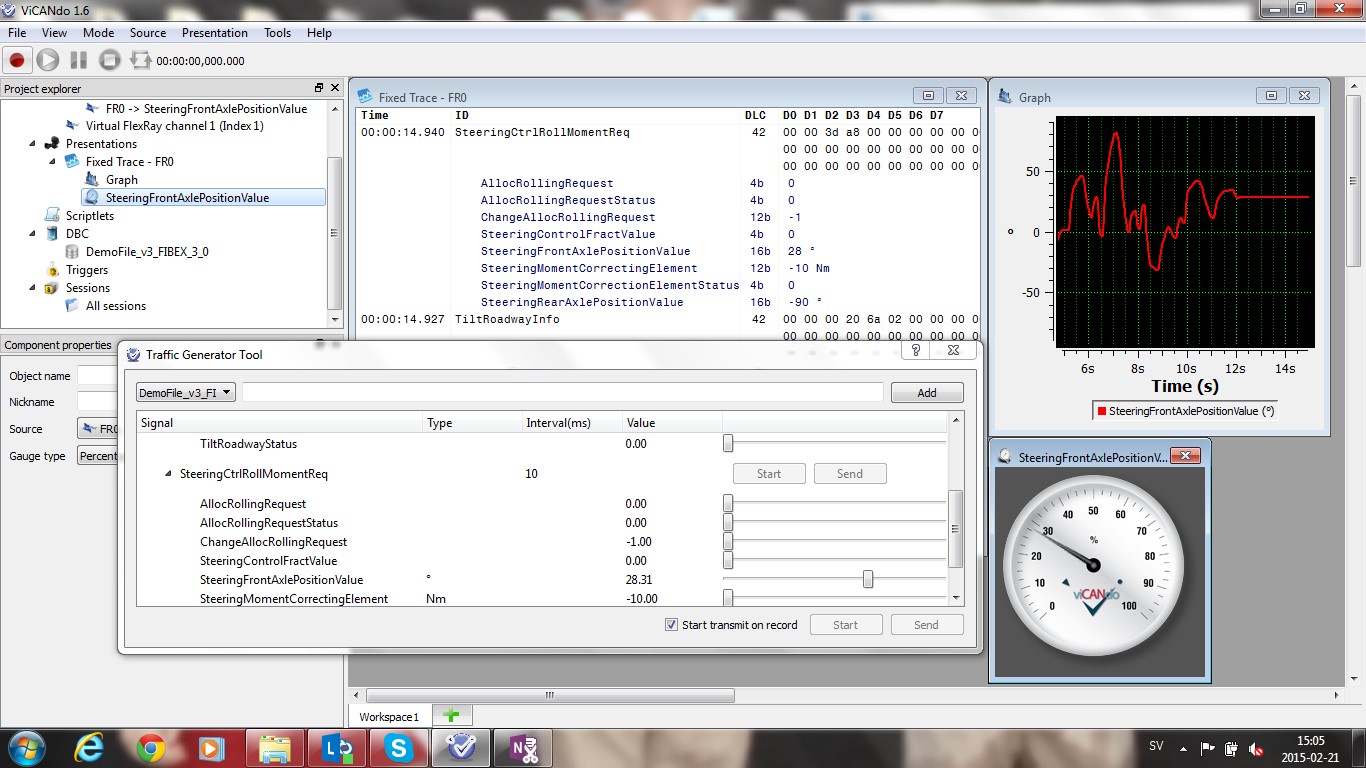
Going forward, the function is perfectly same as it is in the case of CAN or LIN. You can call up the signals for association actions like triggers or plots.
And also create traffic generators.
The method of associating the signals with trace or graph windows is exactly the same as with all other busses.
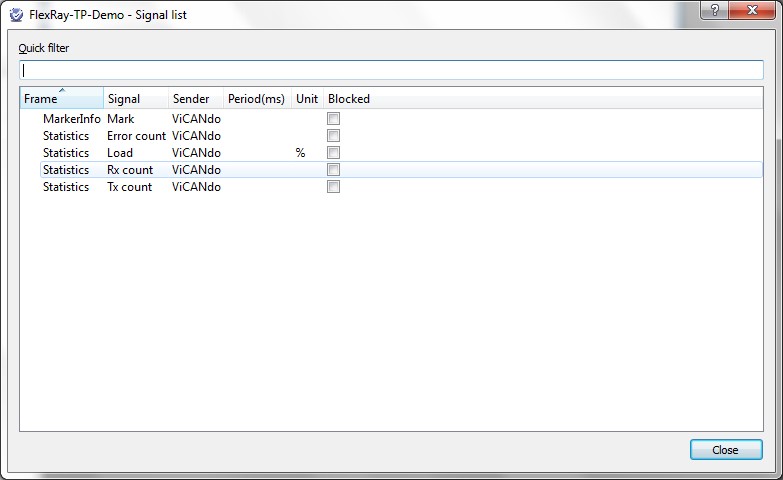
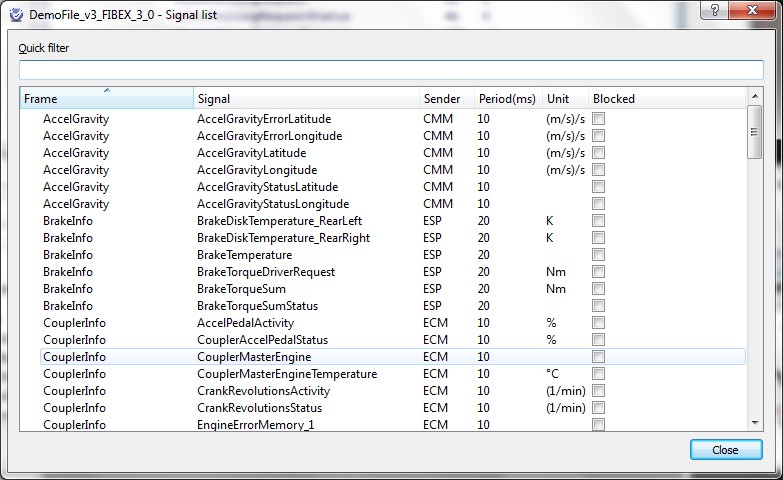
Incase you want to have a signal list view, you can right click in the fixed trace window on a particular signal or press Ctrl+F12.
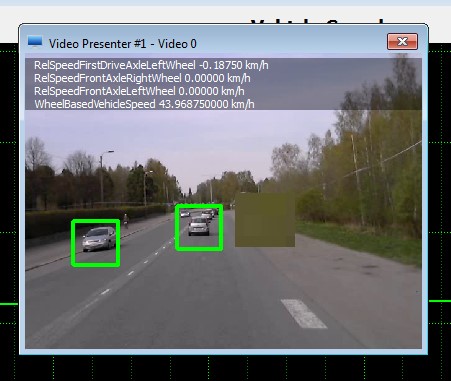
4.11 Working with lane and vehicle detection
In ViCANdo 1.6 or later versions, there are options for detecting lanes, other vehicles and number plates. However, these functions may vary from market to market so please contact your local Zuragon contact in order to get appropriate advice.
If you want to activate the detection overlays, right click on the actual video presenter and choose whichever option(s) you want activated.
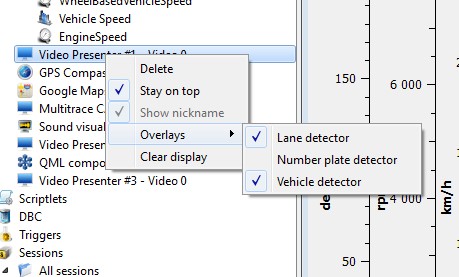
Once activated, they will show up in the video window right away.
4.12 Working with import of multiple video sources from other tools
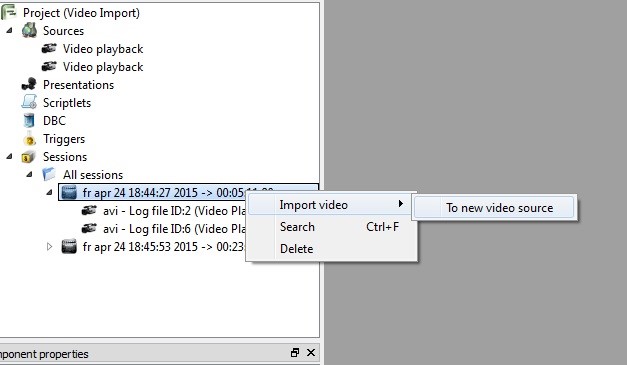
When working on the development of algorithms, sometimes you need to be able to reuse the legacy of recorded videos. To import a legacy video, make sure that it is in .mpeg, .mp4 or .avi format. Next, right click on the session folder.
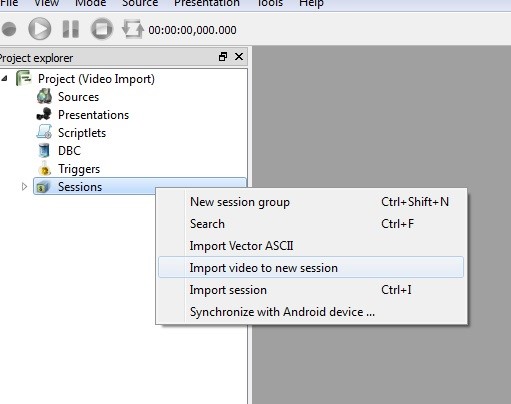
And then go to the Import video option. Thereafter, select the To new video source option, as there are currently no video sources that exist.
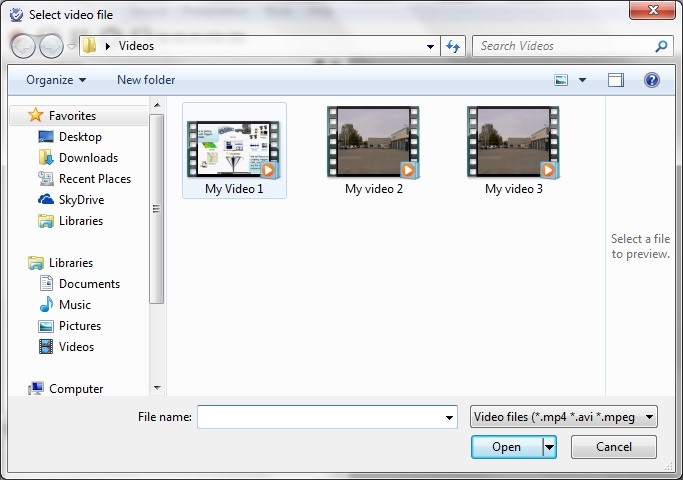
Now, choose the file of your interest and click Open.
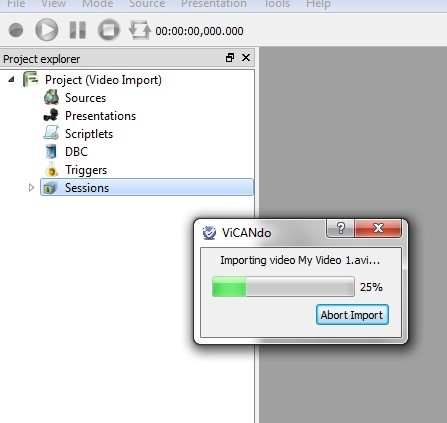
ViCANdo will start importing the file so as to make it a part of the ViCANdo project. This activity might take sometime depending on the size of the file selected.
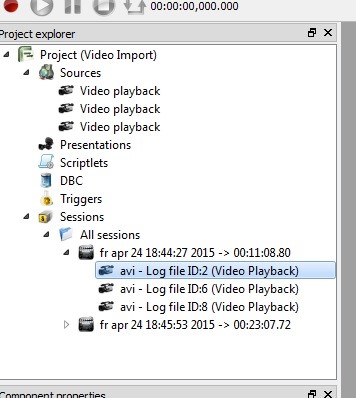
Once the file is imported and is part of the project, if you would like to import another video file in order to try out the algorithms on videos with various conditions, you just need to repeat the steps above and build up a library of video logs inside ViCANdo. It’s also possible to combine this with the import of other logs from existing CAN, FlexRay or Ethernet log files. The flow of work will be the same.
4.13 Working with LiDAR sensors
ViCANdo supports several market leading LiDARs, such as Velodyne , Hesai Pandar , IBEO and Robosense LiDARs.
LiDARs were used in a wide range of fields, like autonomous vehicles, industrial machinery, 3D mapping and surveillance. Most lidars outputs data via Ethernet. For example, Velodyne LiDAR sensor outputs UDP network packets which include range and intensity data of the lasers in the device. ViCANdo offers real-time visualization of live captured 3D LiDAR data from LiDAR sensors. Follow below instructions to learn how to use lidar presenter in ViCANdo.
4.13.1 Setup Velodyne LiDAR viewer
The Velodyne HDL-64e and HDL-32e sensor output UDP network packets on the 192.168.3 subnet, port 2368 by default. The HDL-32e with latest firmwrae allows you to customize this network subnet. You can connect the Velodyne sensor either to your computer or a network switch. Please read the user guide of the sensor from Velodyne to setup the network. Make sure your PC(where ViCANdo is running) is in the same network as Velodyne lidar.
Next step is to add a UDP socket from Source menu. The UDP socket port number should be the port number the sensor is using. For example, Velodyne lidar broadcasts data from 10.42.42.35 port 2368, in ViCANdo you need to add a UDP socket with server mode:
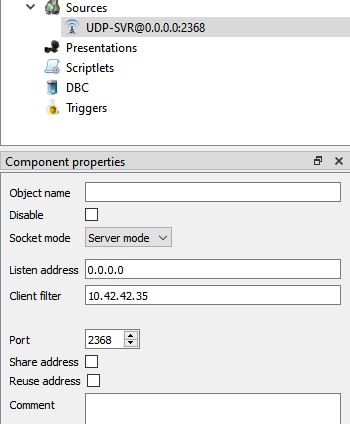
The listen address should be the address of the network interface on the host PC where Vicando is running. Set it to 0.0.0.0 will listen to all the UDP @configured port comming into the host PC.
In the Client filter you can specify the IP address of the lidar. This is useful if you have multiple lidars connected to the network.
Then you can add a Multi Trace from Presentation menu for this source to view the lidar data.
To visualize the point cloud data, click menu Prensentation and select Velodyne LiDAR viewer, set the UDP source as the Source of the viewer.
The viewer window looks like this:
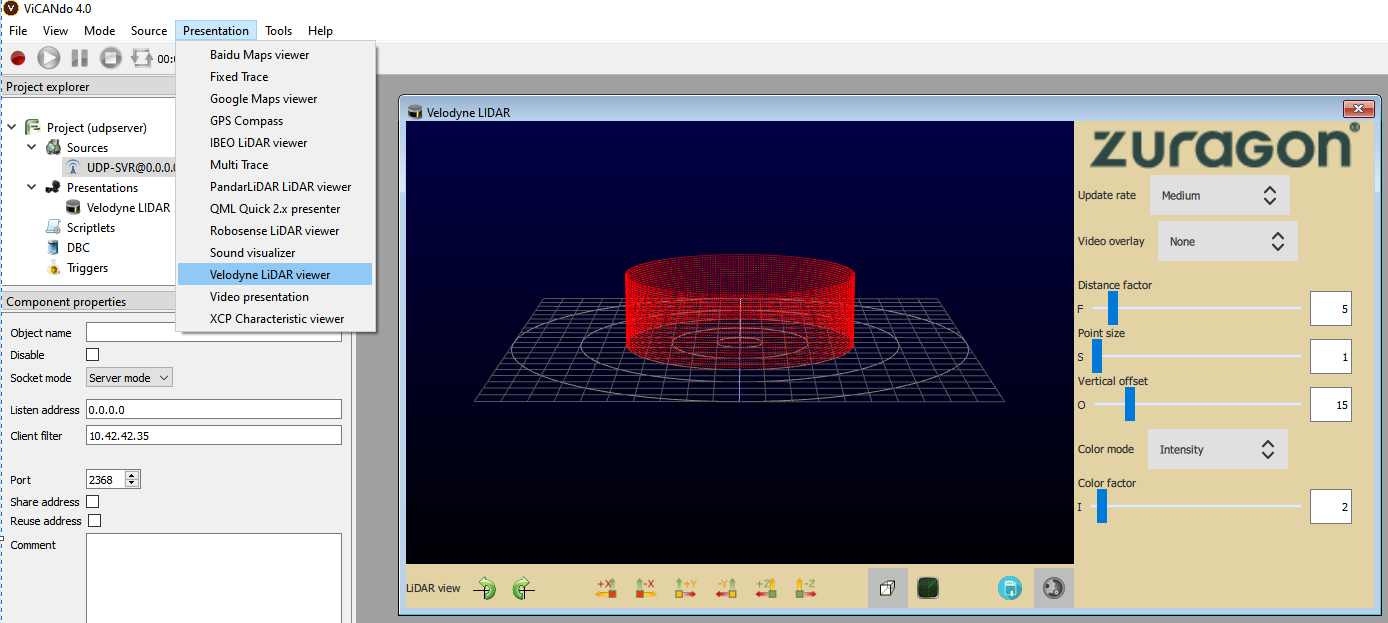
The left part of the viewer displays the point cloud data from the Velodyne sensor. You can rotate the diagraph and change the view type to top view, side view, front view etc. using the icons on the bottom.
The right part of the viewer opens when you click on the bottom right corner icon called settings. It allows you to change e.g. update rate and distance factor.
The source and presenter/viewer configuration for other lidars such as Robosense and Pandar lidar is similar to the configuration for Velodyne.
For Robosense lidar, it is also good to configure the distance resolution mode ( 0.5 cm or 1 cm) if you know, type of lidar, if needed, add the calibration files from the lidar viewer’s component properties window:

4.13.2 Import PCAP files
PCAP - a network packet capture file format, is used mostly by Wireshark which is a popular network packet analyzer program. Many people use this PCAP file format to record and playback lidar packets.
Lidar vendors offer some sample PCAP files on their websites which can be used for testing before purchasing the sensor.
To see how the sensor data works in ViCANdo, you can download the PCAP file and then create an empty project in ViCANdo. Right click on All sessions and select Import PCAP:
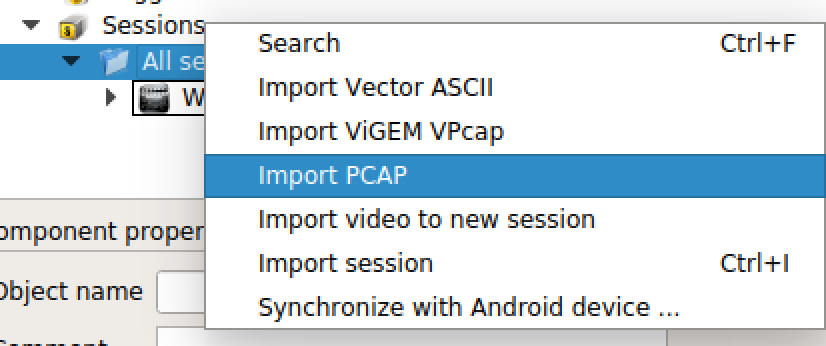
Then a Ethernet source will be created after the import is finished. You can add a Multi Trace to view the data when playing the session.
Pause the session and check the data in Multi Trace, navigate to the UDP data row, find out the sender’s IP address and port number of the UDP data in the log. The IP address
and port number is used by the lidar to output point cloud data.
Then add a UDP socket from source, in Spy mode, configure the “from address” to the lidar’s IP address and port. Click on the Ethernet log file it will automatically
generate the UDP log file for the new UDP socket source.
Then add a multi trace and lidar viewer for the UDP socket source to view the data.
Then play the session, the point cloud data will be visualized in the lidar viewer.
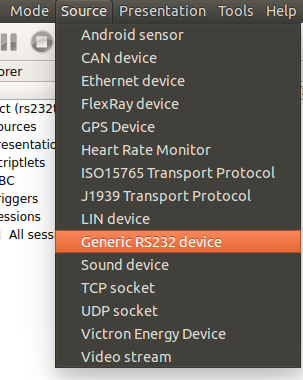
4.14 Working with RS232 Source
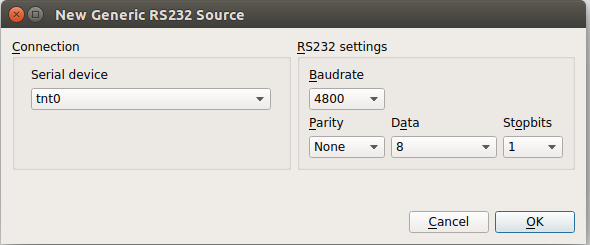
ViCANdo 2.2.67 or later versions supports adding RS232 sources from the Source menu. You can setup a RS232 source to listen to the traffic from the serial port.
Then you can configure the RS232 port and baudrate etc. settings shown in below window:
After you have added the source to the project, click on it and you will see the Component properties window on the bottom:
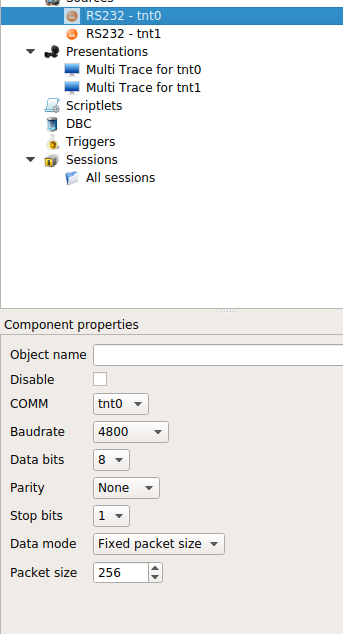
There are two display modes for the traffic: Fixed packet size and text data. Then add a Multi Trace for this source to see the traffic. For example:
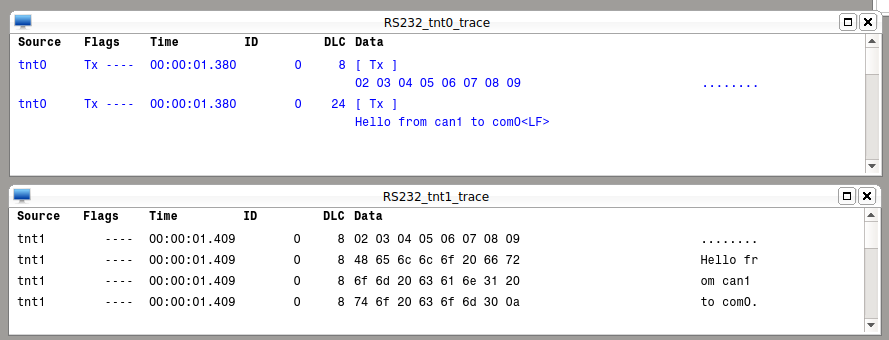
To learn how to use the RS232 source with QML, download and open this UDP to CAN demo The demo sent the data from UDP socket to CAN and RS232 sources.
4.15 Working with MATLAB
Matlab is a powerful tool to develop advanced driver assistance system. Click here to read more.
With ViCANdo, user can exchange data with Matlab and use the Matlab engine to process the data, e.g. video frames data, CAN data. To be able to use ViCANdo with Matlab, you need:
Step 1: Make sure you have installed Matlab on your PC
Note
Since Matlab is a 64-bits application, you need to use the 64-bits version of ViCANdo with it.
Step 2: On Windows, add the path of your Matlab to the System Variable “Path” to tell Windows where the matlab API shared libraries reside. An easier way to do it is to type below command in your Matlab window to get the path:
res = fullfile(matlabroot,'bin',computer('arch'))
Then type below command to add the path to your system variable “Path”:
set PATH=res;%PATH%
(Above steps are described from this link )
Step 3: Download the ViCANdo Matlab Demo project and open it(You may need to manually re-load the MatlabTest.qml under qml folder in the project due to the change of the absolute file path, The QML file needs to be attached to the video source):
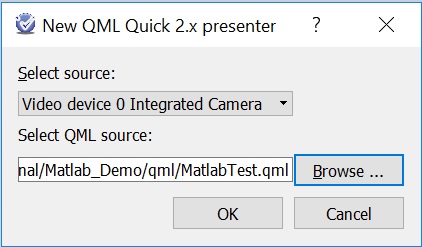
The QML file “MatlabTest.qml” under qml folder is the main file that sends the video frame(the top video view) data to Matlab engine and expects some result from it and display the result on the bottom video view area, see below screenshot:
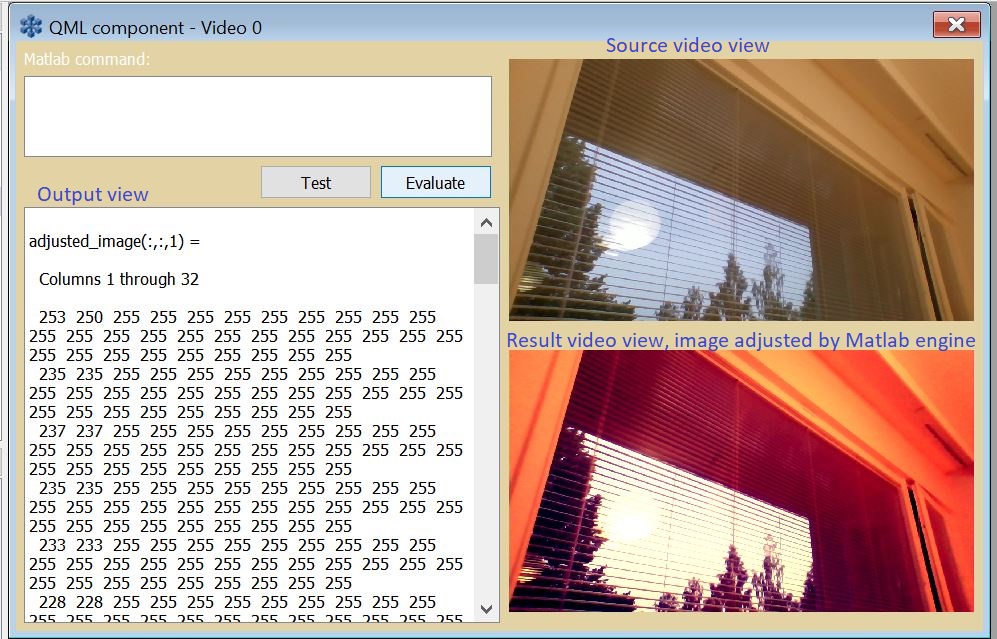
When you click on the “record” button on the top left corner in ViCANdo, the QML will execute the matlab engine and a Matlab command window will open automatically after few seconds. The evaluate button is for matlab engine to evaluate the above command you have typed. For detailed description of the Matlab QML API in ViCANdo, please refer to this Matlab QML API
4.16 Working with Matlab and Simulink
Simulink is an add-on component in Matlab. in ViCANdo it is possible to transfer data to and from Simulink via Matlab. One way is to use the From Workspace and To Workspace function blocks in your Simulink model. The work flow is like this:
- Put the data captured in ViCANdo as variable using Matlab engine. The variable will be stored inside the Matlab Workspace.
- Use the From Workspace block(where the variable name should be the variable name in above step) as input inside your Simulink model.
- Create your Simulink model.
- If you want to send the simulink result/output back to ViCANdo, use the To Workspace block.
- In your ViCANdo QML script, read the variable specified in the To Workspace block.
4.17 Working with LeddarTech Vu8 lidar sensor
LeddarTech is a leader in optical detection and ranging technology. The lidar sensors come with CAN interface. The detections can be transmitted on CAN bus. In ViCANdo it’s possible to capture the detections using QML & JavaScript to write an extention component. Download LeddarTech Vu8 Demo project to learn how to write your own custom QML script. The QML demo looks like this:
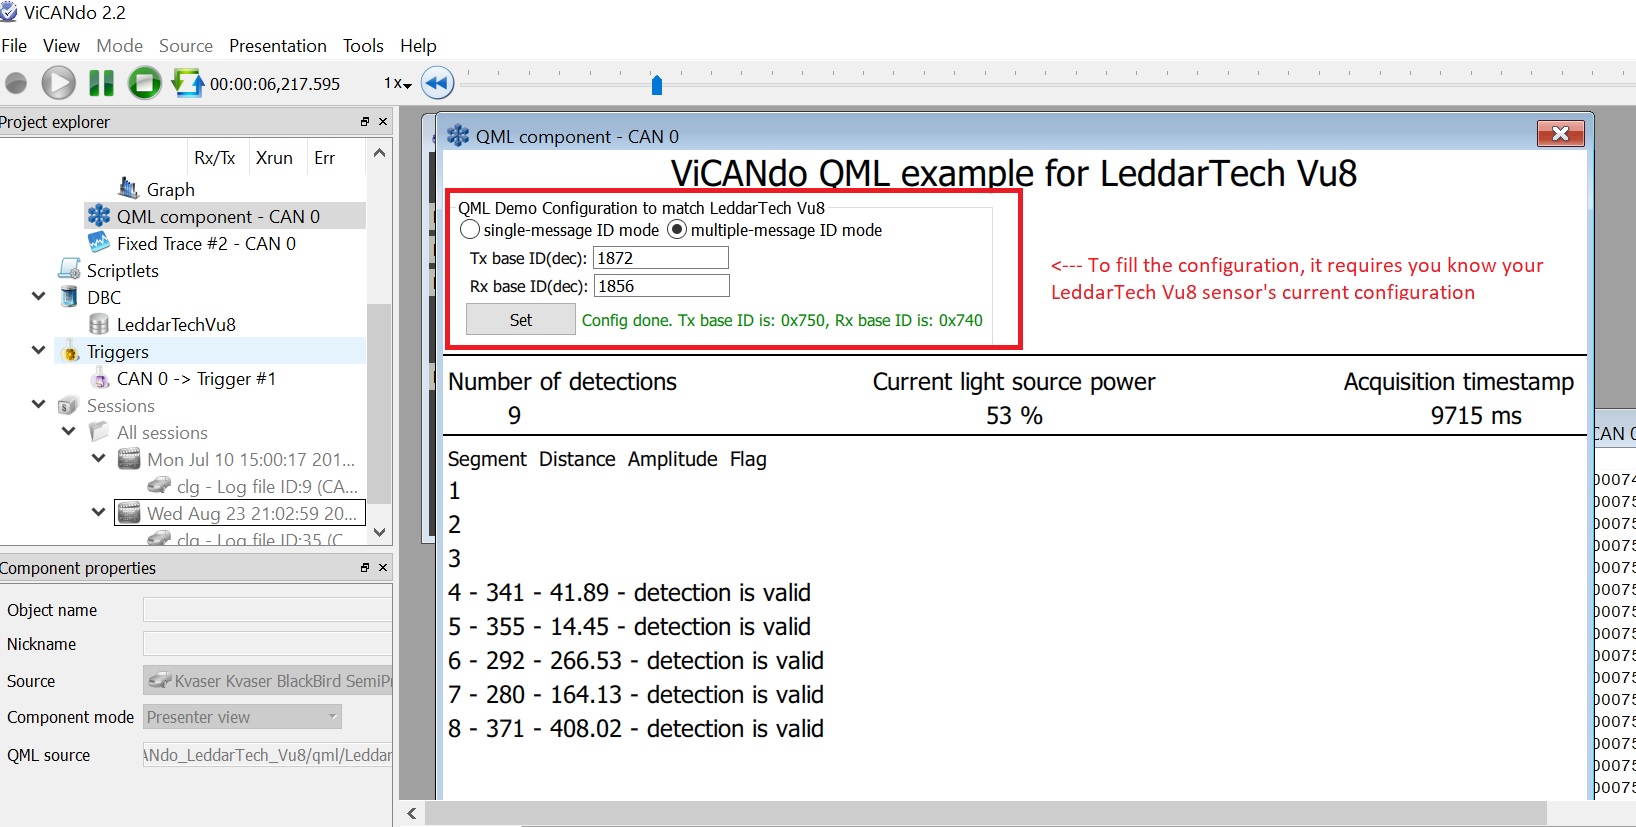
There are two logs/sessions inside the project, first one is logged when LeddarTech Vu8 is configured in single-message ID mode with default base IDs, i.e. all the detections will be transmitted via a CAN message. The second one is logged when the sensor is configured in multi-message ID mode, i.e. the detections will be transmitted via few CAN messages. To see how the detection looks like, select the session( if first session is selected, configure single-message ID mode in QML componnet), then click on the play button. You will see the detections from 8 segments displayed on the lower window.
Inside the demo project, under the spec folder you will find the LeddarTech Vu8 user guide and under qml folder you will find the QML demo source code. If you are new to LeddarTech lidar products, you need to register an account from LeddarTech support portal and download the specific configurator tool for your sensor first. Once the sensor is configured, then you need to set the same configuration in your ViCANdo QML component, after that, you are ready to go and make logs with ViCANdo.
4.18 Working with MccDAQ analog and digital I/O devices
Mcc DAQ provides PC-based data acquisition hardware. In Vicando it is possible to capture analog and digital inputs from MccDAQ devices.
Contact our support or distributors to check if your MccDAQ device is supported or not, or for recommendations on device selection.
To use MccDAQ device with Vicando/Vicanlog, first of all you need to install the drivers of the MccDAQ devices.
On Windows, InstaCal Driver from MccDAQ is needed, download it from:
https://www.mccdaq.com/Software-Downloads
On Linux, download and install the uldaq library:
https://github.com/mccdaq/uldaq
Below is a collection of the commands written in above uldaq library page. You need to execute them if you are using Ubuntu:
$ sudo apt-get install gcc g++ make
$ sudo apt-get install libusb-1.0-0-dev
cd to your downloads folder and
$ wget -N https://github.com/mccdaq/uldaq/releases/download/v1.2.0/libuldaq-1.2.0.tar.bz2
$ tar -xvjf libuldaq-1.2.0.tar.bz2
$ cd libuldaq-1.2.0
$ ./configure && make
$ sudo make install
if your MccDAQ device is not supported by uldaq library, you may need to check the third party library from here: https://github.com/wjasper/Linux_Drivers
Then plugin the device and open Vicando/vicanlog.
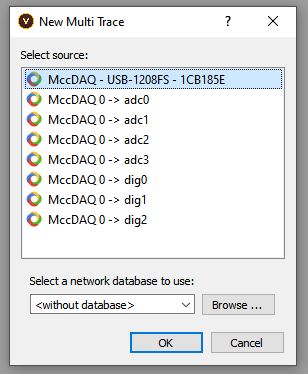
Go to menu Source -> MccDAQ device to add a new device, specify how many analog inputs and digital inputs you want to use.
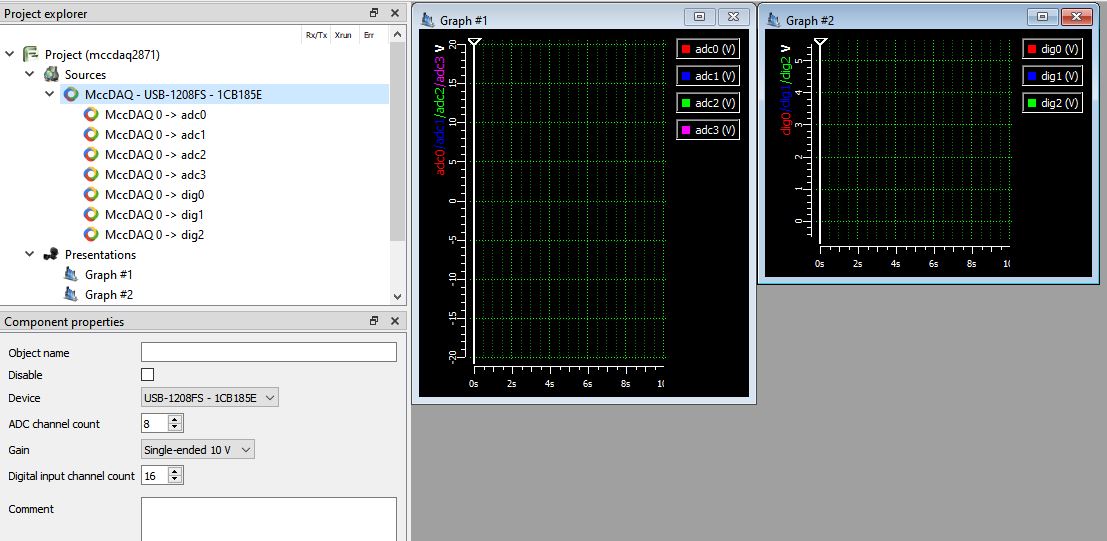
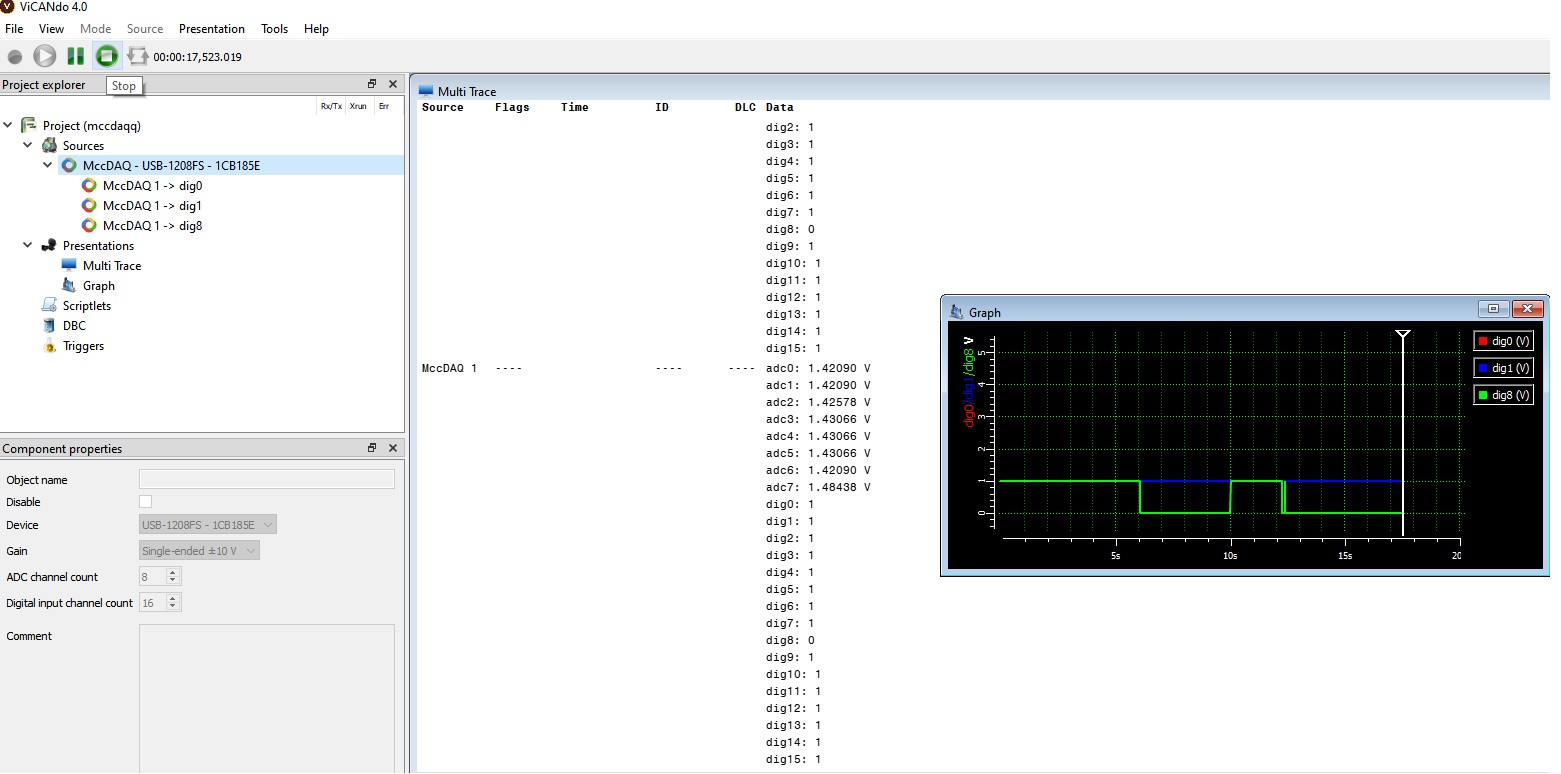
Multi Trace can be used to display the data for MccDAQ devices.
If you want to add the single channel to graph, you can do so by right clicking on the MccDAQ device under source and select the channel and add it to graph or create a new graph.
- Below is a list of the MccDAQ devices we have tested:
- USB-1208FS ( works only on Windows, 08.2020), url: https://www.mccdaq.com/usb-data-acquisition/USB-1208FS.aspx
- USB-DIO32HS, url: https://www.mccdaq.com/usb-data-acquisition/USB-DIO32HS-Series
- USB-3103, url: https://www.mccdaq.com/usb-data-acquisition/USB-3100-Series.aspx
4.19 Working with XCP and A2L
The XCP protocol is used for engineers to access the variables and memories of a ECU. ViCANdo supports XCP over Etherent(TCP and UDP) and XCP over CAN.
To use XCP, you need to first create a CAN source(with Fixed trace) or TCP/UDP source(except Spy mode) with a Multi trace in the software, then select Source -> XCP Transport Protocol:
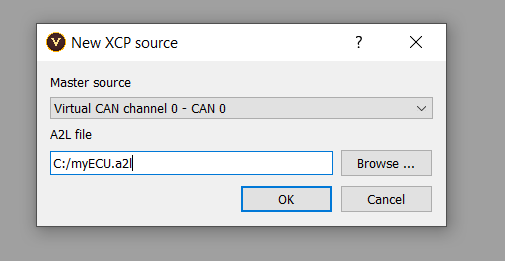
You can specifiy the source and path to A2L file in above dialog.
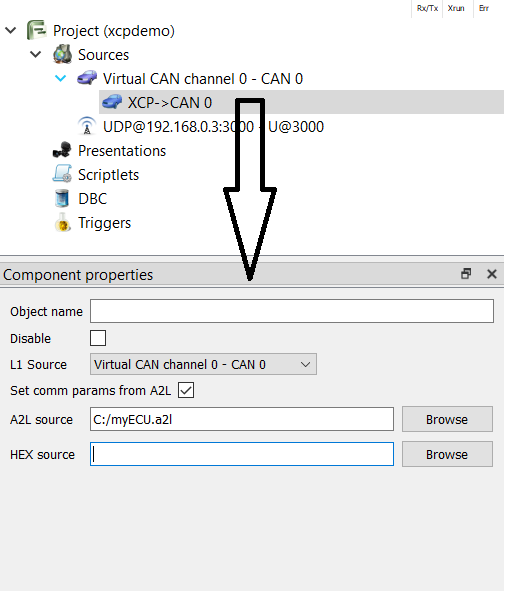
You can also change the settings and specify the path to HEX file(the firmware of the ECU) in the Component properties window of the XCP source:
To view the A2L file, right click on the XCP source(that is added as a slave source in the project tree) and select from the context menu:
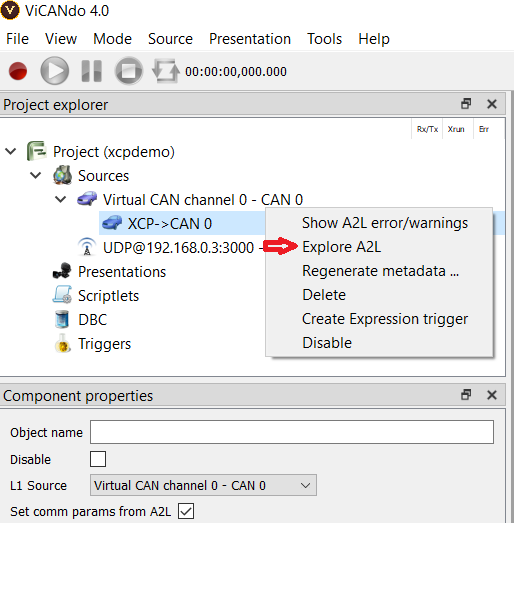
It will open the A2L explorer window from where you can read and write the measurements, characteristics and memories:
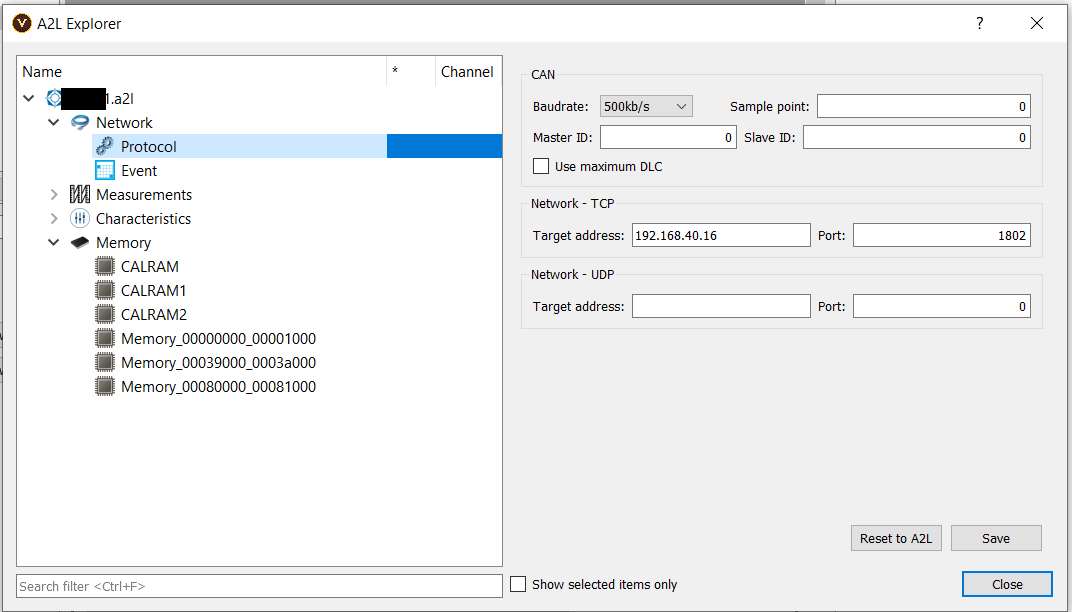
Measurement
Check the checkbox of the measurement and specify the channel on the A2L explorer. It will add the meassurement as a “slave source” to the project tree under the XCP “slave source”.
You can either right click on the measurement in the project tree to create a graph or use the Multi Trace to view the data.
Characteristics
Check the checkbox of the characteristic entry, it will be added to the project tree.
To view the characteristic you will need to add a XCP Characteristic viewer under Presentation menu.
To edit the characteristic:
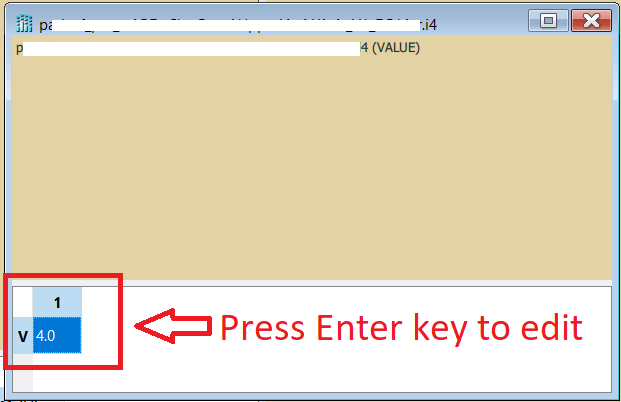
It will send a XCP write command via the source ( CAN or TCP or UDP) where the XCP source is attached to.