Visualizing lidar point cloud data in ViCANdo
ViCANdo supports visualizing point cloud data from various lidar sensor vendors, such as Velodyne lidar, RoboSense lidar, ibeo lidar, Panda lidar from HESAI. In the SDK it is also possible to develop your own GUI for the lidar. In this article we are going to explain how it works and what you can do with it.
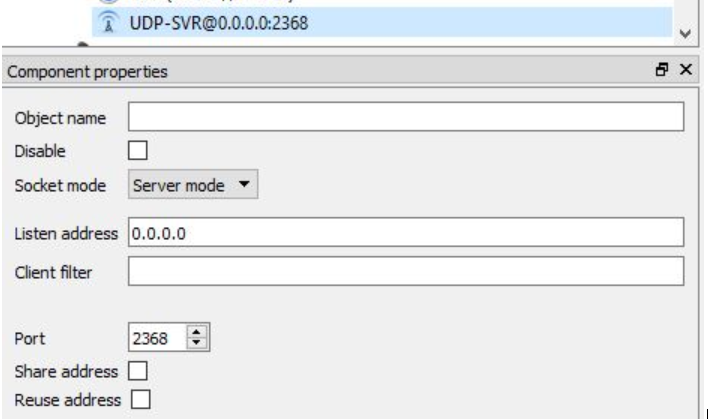
Most of the lidar transmit point cloud data over UDP. In ViCANdo you can either add a UDP socket from the source menu and configure the address and the port to listen to, or add an Ethernet source and UDP socket on spy mode. The latter method will give you both Ethernet log file and UDP log file. RoboSense lidar, Panda lidar and Velodyne lidar have similar viewers. Take Velodyne lidar as an example, it by default broadcasts the data on port 2368. Below example shows you how to configure the UDP source in ViCANdo:
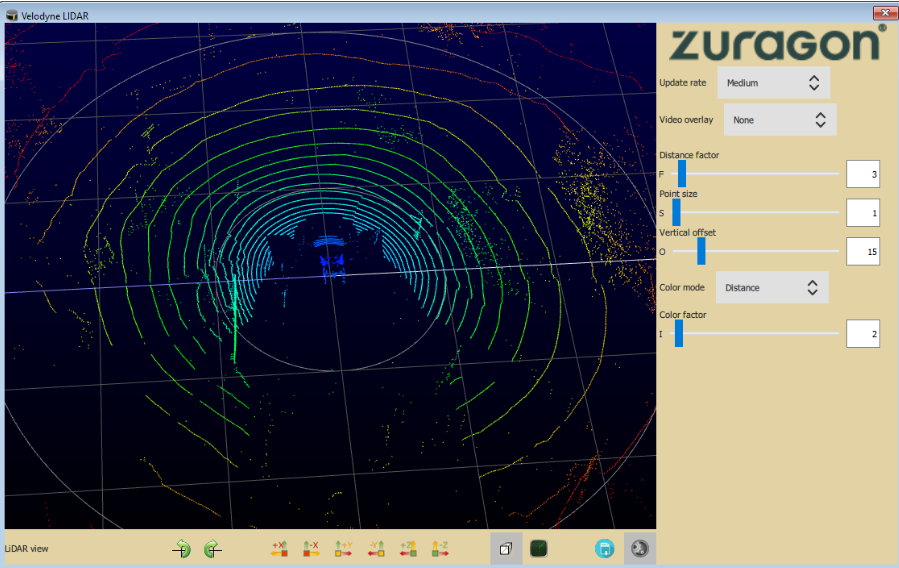
Then the next step is to add a “Velodyne LiDAR viewer” from the Presentation menu to the project:
You can rotate the point cloud data, change viewing axis as well as configure lots of other settings on the right panel. SDK allows you to access the X,Y, Z as well as other information from the lidar data. With the PCL example inside the SDK, you can also use the open source Point Cloud Library(PCL) for algorithms for point cloud processing tasks. Read more from here: http://www.pointclouds.org/documentation/
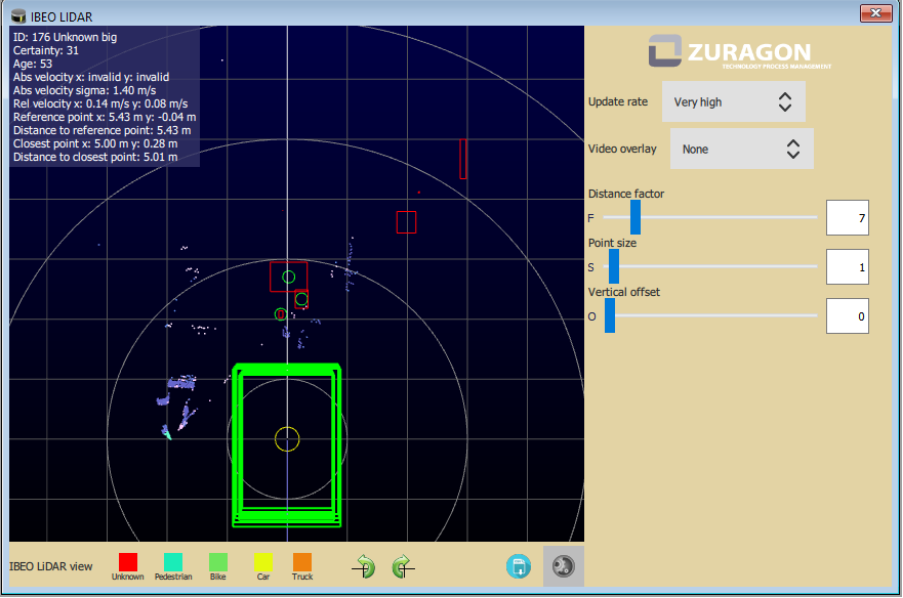
IBEO lidar viewer:
Ibeo lidar returns a list of objects. In ViCANdo different objects were classified using different colors according to the lidar specification. When clicking on the object, the detailed information of the selected object is displayed on the top left corner.
We provide development services to help you to develop customized solutions that fit your application need. Please contact us or our distributor in your country for more information.